infographic of site logo for contact us

OwnProCrypto.com

Use our Crypto Search Engine 🔍 to find the topics and keywords you're looking for.

Crypto Risk Fingerprint Tool — Market, Liquidity, Tokenomics, Protocol & Concentration Risk

Crypto Risk Fingerprint Tool — Market, Liquidity, Tokenomics, Protocol & Concentration Risk

Build a five-dimensional risk fingerprint for any cryptocurrency using market, liquidity, tokenomics, protocol and concentration data.

🪙 Identify the Asset Required
Enter the asset name and ticker exactly as you want them displayed on the fingerprint.
Source: CoinGecko / CoinMarketCap
Not used in the score; shown for context.
📊 Volatility & Drawdown Required
Measures how violently and unpredictably the asset has historically traded.
💧 Volume, Depth & Spread Required
How difficult could it be to enter or exit this asset without significant market impact?
Source: exchange / market data
Narrow = healthy. Wide = exit risk.
Total value within 2% of mid price.
🪙 Supply, Inflation & Unlocks Required
Measures dilution, inflation, unlock pressure, allocation and supply concentration.
Source: project docs / token data
🔐 Security & Dependencies Required
Security history, control structure, dependencies and maturity of the protocol.
Source: audit reports / project docs
Admin control + upgradeability share underlying risk.
"None" is a low-risk state — not penalized.
🐋 Holder Concentration Required
Who can materially influence the asset? Measure broad, insider and treasury concentration.
Source: blockchain explorer / analytics
—
0
/ 100
—
📊 Data Completeness Confidence 0%
—
⚠ Primary Risk Driver
—
—
—
🚨 Risk Triggers
💡 Why This Score?
🔄 What Could Change This Score?
Scenario values are sensitivity illustrations based on the scoring model, not forecasts of actual market outcomes.
🧭 How the Score Is Built
↓
Overall Structural Risk Score (0–100)
Methodology

This tool produces a rule-based structural risk score using user-provided market, liquidity, tokenomics, protocol and concentration data. Scores are weighted and normalized to a 0–100 risk scale.

Overall Risk = (Market × 0.25) + (Liquidity × 0.20) + (Tokenomics × 0.25) + (Protocol × 0.20) + (Concentration × 0.10).

The result is a screening framework, not a prediction of future price performance or investment advice.

Assessment generated: —
Data completeness: —

Crypto Risk Fingerprint Tool


Build a five-dimensional risk fingerprint for any cryptocurrency using market, liquidity, tokenomics, protocol and concentration data.

Infographic of Crypto Risk Fingerprint Tool — Market, Liquidity, Tokenomics, Protocol & Concentration Risk 2026
Crypto Risk Fingerprint Tool


🎯 What This Crypto Risk Fingerprint Is For

Most crypto risk calculators give you a single number and call it a day. That number tells you that an asset is risky — but not why, or where the risk actually comes from.

The Crypto Risk Fingerprint Tool is built for the opposite purpose. Instead of a flat score, it produces a structured five-dimensional risk fingerprint that shows exactly how an asset’s structural risk is distributed across:

The Five Dimensions
  • Market Risk — volatility, drawdown and market-cap tier
  • Liquidity Risk — volume, depth, exchange coverage and spread
  • Tokenomics Risk — dilution, inflation, unlocks and allocation
  • Protocol Risk — audits, control structure, dependencies and maturity
  • Concentration Risk — top holders, insiders and treasury exposure

This is a structural screening and due-diligence framework, not a price prediction. It does not tell you whether to buy or sell. It tells you what kind of risk you are actually taking on — and where it lives.
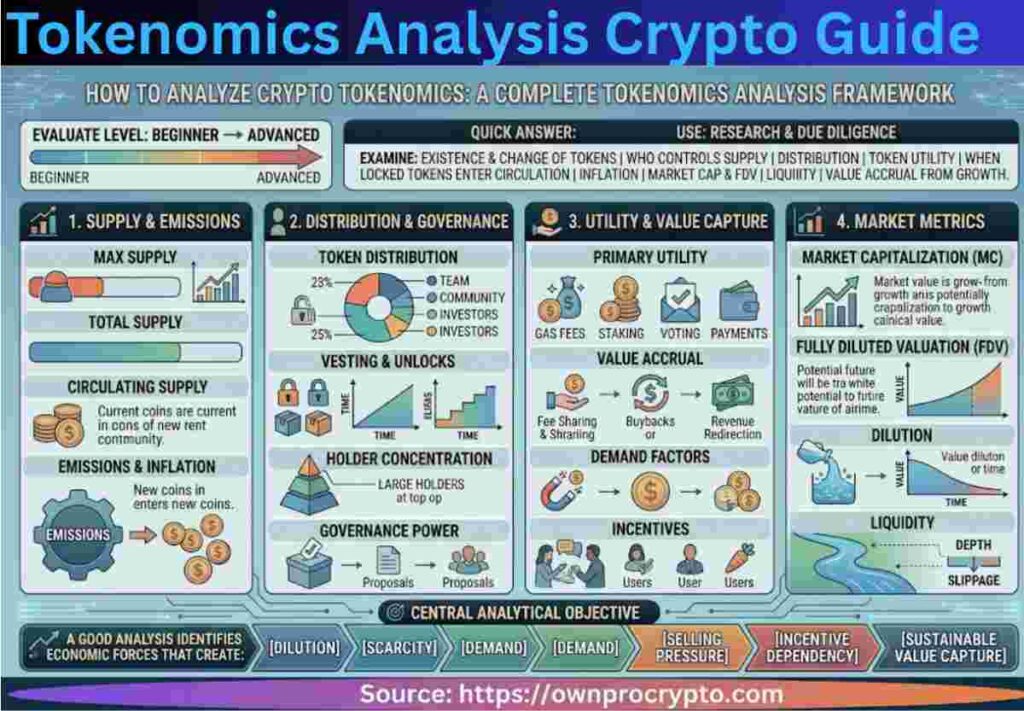
Infographic of How to Analyze Crypto Tokenomics: A Complete Tokenomics Analysis Crypto Framework 2026
Tokenomics Analysis Crypto Framework
✅ Why It’s Different
Compared to a typical crypto risk calculator
  • Shows shape, not just score — the fingerprint reveals which dimensions drive risk
  • Transparent formulas — every module exposes its weighted components
  • Data completeness confidence — missing data reduces confidence instead of silently becoming zero
  • Dynamic triggers — critical, warning, watch and positive signals generated from actual thresholds
  • Primary risk driver + main factor — automatically identifies the biggest contributor and its leading subcomponent
  • Sensitivity scenarios — shows how the score could shift under specific changes
  • No investment language — no “safe”, “buy”, or “guaranteed” phrasing
Who it’s for
  • Investors doing due diligence on a specific token
  • Analysts comparing structural risk across assets
  • Researchers studying tokenomics or liquidity profiles
  • Anyone who wants to understand where the risk is, not just how much


⚙️ How Crypto Risk Fingerprint Works

The tool is a rule-based scoring engine. You provide structured inputs across the five modules. Each module calculates an independent 0–100 risk score using a transparent, documented formula. Those five scores are then weighted into a single overall structural risk score.

Overall weighting
  • Market Risk — 25%
  • Liquidity Risk — 20%
  • Tokenomics Risk — 25%
  • Protocol Risk — 20%
  • Concentration Risk — 10%

Higher score = higher structural risk. The score is a screening framework, not a forecast.


🪜 Crypto Risk Fingerprint: Step-by-Step
1
Enter asset details
Type the asset name and ticker as you want them displayed. Add market cap and price if you have them.
2
Fill in Market Risk inputs
30-day and 90-day volatility, 30-day and 1-year maximum drawdown.
3
Fill in Liquidity Risk inputs
24h trading volume, number of exchanges, bid/ask spread and (if available) 2% market depth.
4
Fill in Tokenomics Risk inputs
Circulating and maximum supply, annual inflation, 12-month unlock %, insider and treasury allocation.
5
Fill in Protocol Risk inputs
Audit status, exploit history, upgradeability, oracle dependency, bridge dependency and protocol maturity.
6
Fill in Concentration Risk inputs
Top 10 and Top 20 holder concentration, insider concentration and treasury/foundation concentration.
7
Click “Analyze Risk Fingerprint”
The tool validates inputs, calculates the five modules, weights them into an overall score, and renders the fingerprint.
8
Read the fingerprint
Review the overall band, the five-module bars, data completeness confidence, the primary risk driver, dynamic triggers, “why this score” and sensitivity scenarios.
9
Adjust and recalculate
Change any input and click “Recalculate Risk Fingerprint” to update cleanly. Use “Reset Inputs” to start fresh.
Image used for FAQs Frequently Asked Questions and their Answer about How to Build Your Brand and Mission showing & solving Complex Business Problems
FAQs Frequently Asked Questions
❓ FAQs
Is this a buy or sell signal?
No. The tool produces a structural risk fingerprint. It does not predict price, and it does not give investment advice. Use it as a screening framework alongside your own research.
What does a higher score mean?
A higher score means higher structural risk based on the inputs you provided. It reflects the shape of risk across market, liquidity, tokenomics, protocol and concentration — not the likelihood of any price outcome.
Why does the tool ask for so many inputs?
Because risk is multi-dimensional. A single number from a shallow quiz cannot tell you whether an asset is riskier because of dilution, thin liquidity, or concentrated ownership. The fingerprint does.
Where do I get the input values?
Market data from CoinGecko or CoinMarketCap. Holder concentration from a blockchain explorer or analytics provider. Tokenomics from project documentation and token unlock data. Protocol security from audit reports and project documentation. Liquidity from exchange or market data.
What if some data is missing?
The tool never silently treats missing data as zero risk. Missing optional fields reduce the data-completeness confidence score, and each module shows a status indicator (Complete, Partial or Limited) so you know how much to trust that dimension.
Can I compare two assets?
Yes. Run the tool once for each asset, save or screenshot the fingerprint, and compare. The five-module breakdown makes it easy to see where two assets differ structurally.
Does the tool predict price?
No. It is a rule-based structural risk screening tool. It does not forecast returns, drawdowns, or market outcomes. Scenario values are sensitivity illustrations, not forecasts.
Is my data stored anywhere?
No. All calculations happen in your browser. Nothing is sent to a server.

   External Tokenomics Research Sources

    Token supply data can differ between providers. For serious research, verify important figures against primary protocol documentatio and established market-data methodologies.

Research rule

Use aggregators for discovery and comparison, but verify material tokenomics claims against the project’s own documentation, governance records, contract behavior or other primary evidence whenever possible.


🔍 Build Your First Fingerprint

Five dimensions. One structural risk score. A fingerprint that shows you exactly where the risk lives.

Launch the Crypto Risk Fingerprint Tool

Looking for another topic? Search the OwnProCrypto research archive.
Comments
💬 What’s Your Take? Leave a Comment Below 0
📚 Explore Crypto Research Select a research category