infographic of site logo for contact us

OwnProCrypto.com

Use our Crypto Search Engine 🔍 to find the topics and keywords you're looking for.


Crypto Research Framework

How to Analyze Crypto Tokenomics: A Complete Tokenomics Analysis Framework

Crypto tokenomics analysis helps you understand how a token’s supply, distribution, inflation, unlocks and ownership structure can influence dilution, selling pressure, scarcity and long-term risk.

⚡ Quick Answer

To analyze crypto tokenomics, examine five major areas: supply structure, dilution and inflation, token unlocks, allocation structure, and holder concentration. The goal is not simply to determine whether a token has a large or small supply. The goal is to understand who controls the supply, how quickly new tokens can enter the market, and whether future supply growth can create selling pressure.
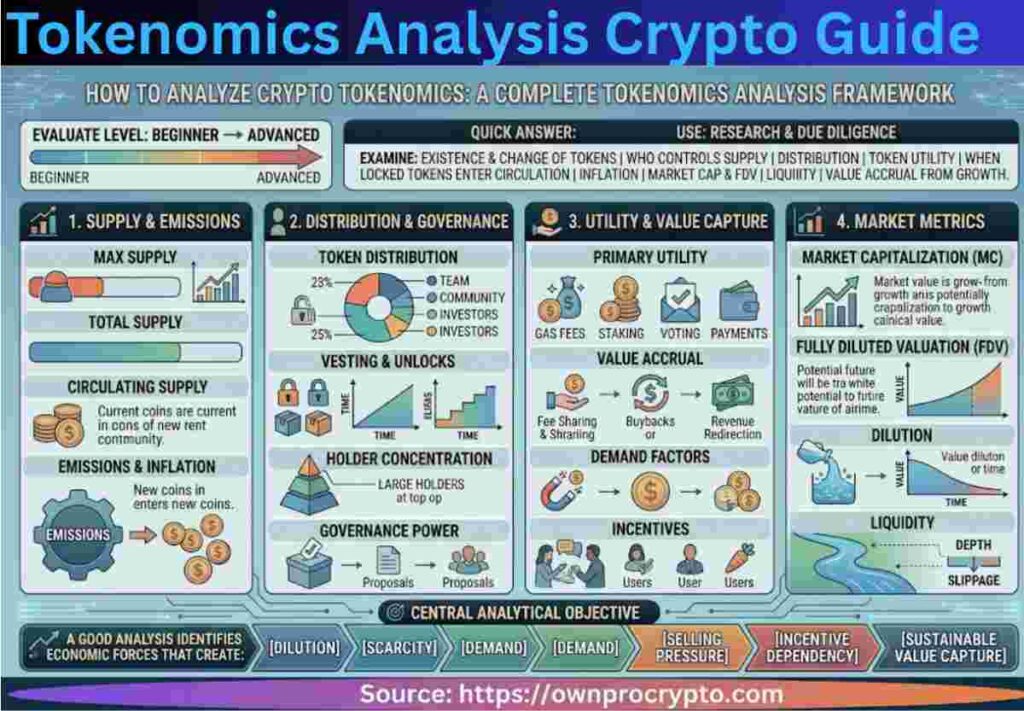
Infographic of How to Analyze Crypto Tokenomics: A Complete Tokenomics Analysis Crypto Framework 2026


What Is Crypto Tokenomics Analysis?

Crypto tokenomics analysis is the process of examining how a cryptocurrency’s token supply is created, distributed, released and controlled.

A token can have strong technology, active users and impressive market growth, but its economic structure can still create substantial risk if a large amount of supply remains locked, insiders control a significant percentage, or inflation continuously increases the number of tokens in circulation.

Think of tokenomics as the supply-side architecture. It explains where tokens came from, where they are going, who receives them and what can change the circulating supply.

Why Tokenomics Matters

Market price is determined by supply and demand. Tokenomics does not tell you exactly where price will go, but it can reveal structural conditions that may influence future supply, liquidity and ownership behavior.

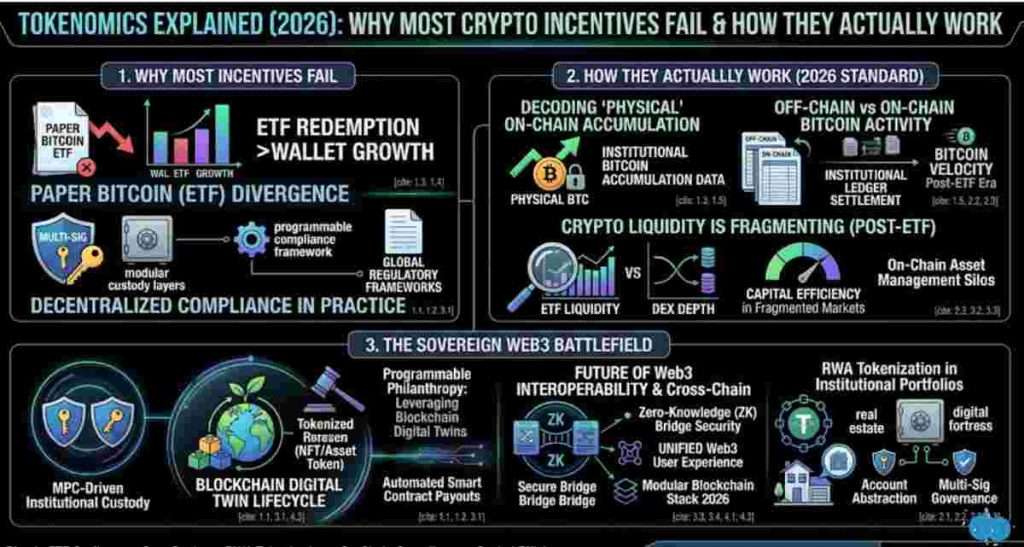
Infographic of Tokenomics Explained (2026) Tokenomics Analysis Crypto

A Five-Part Crypto Tokenomics Analysis Framework

A practical analysis should move beyond one metric such as market cap or circulating supply. Use five connected modules.

01

Supply

How many tokens exist and how much is circulating?

02

Inflation

How quickly can new supply enter circulation?

03

Unlocks

How much previously restricted supply may be released?

04

Allocation

Who received the supply and under what conditions?

05

Concentration

How much supply is controlled by large holders?

The important insight: these modules interact. A token with a high circulating ratio may still carry concentration risk. A token with low current inflation may still face significant future unlock pressure.

How to Analyze Tokenomics Step by Step

Use the following sequence whenever you research a new cryptocurrency, altcoin or token.

1
Check circulating supply

Determine how much of the total possible supply is already circulating.

2
Measure dilution exposure

Compare circulating supply with maximum or total supply where available.

3
Analyze inflation

Determine whether the protocol continuously creates new tokens.

4
Inspect upcoming unlocks

Identify scheduled releases over the next several months.

5
Study allocation and concentration

Determine who controls meaningful portions of the token supply.

Infographic of Blockchain Digital Twins 2026 Showing Advanced Application like : The ESG Revolution: Tokenized Impact Bonds in 2026 - Security Foundation: Asset Security 2026 & Your Digital Fortress Execution Layer - Smart Legal Contract Modules

Analyze Circulating Supply and Maximum Supply

The first step in tokenomics analysis is understanding the difference between circulating supply and maximum supply.

Circulating Supply

Circulating supply represents tokens considered to be available in the market. It is useful because it provides a starting point for understanding current market availability.

Maximum Supply

Maximum supply represents the upper limit of tokens that can exist when a protocol has a defined cap.

Circulating Supply Ratio = Circulating Supply ÷ Maximum Supply × 100
A higher ratio generally means less remaining supply relative to the stated maximum.
Illustrative circulating-supply ratio
95% circulating
 
95%
75% circulating
 
75%
50% circulating
 
50%
25% circulating
 
25%
Important: a high circulating ratio does not automatically mean low risk. You still need to examine inflation, insider holdings, treasury ownership, staking emissions and concentration.
This infographic image shows The Death of Inflationary Yield vs. The Rise of Real Yield

Analyze Token Inflation

Inflation describes the rate at which new tokens are created or introduced into the economic system.

This matters because an expanding supply can dilute the ownership percentage of existing holders if demand does not grow sufficiently to absorb the additional supply.

Questions to Ask

  • Does the protocol continuously issue new tokens?
  • What is the current annual inflation rate?
  • Are tokens created for staking rewards?
  • Are validator or network incentives inflationary?
  • Can governance change the emission schedule?
  • Is there a mechanism that removes tokens from supply?
Inflation is not automatically bad. Some networks intentionally use token emissions to secure the network, reward participants or bootstrap an ecosystem. The important question is whether the emission rate is economically sustainable.

Analyze Token Unlocks

Token unlocks are one of the most important areas of crypto tokenomics analysis. Locked tokens may eventually become transferable or otherwise available to holders.

Why Unlocks Matter

A large unlock can increase the amount of supply available to the market. Whether that creates actual selling pressure depends on who receives the tokens, their incentives, market conditions and whether recipients sell, hold or deploy them.

Illustrative unlock pressure map
0–2% unlock
 
Low
2–5%
 
Watch
5–10%
 
Higher
10%+
 
Stress

Always Identify the Recipient

The percentage alone is not enough. A 10% unlock allocated to a long-term ecosystem treasury is economically different from a 10% unlock allocated to early investors with a defined exit schedule.

Never analyze an unlock percentage in isolation. Combine the size of the unlock with the recipient, vesting schedule, market liquidity and existing holder concentration.
The infographoc of Web3 Stake Crypto for Passive Income (The 2026 Guide to “Digital Rent”)

Analyze Token Allocation

Token allocation tells you how the original supply was distributed among investors, founders, team members, treasury, ecosystem participants, community programs and other stakeholders.

Key Allocation Categories

Team & Founders Large allocations can create concentration and future selling exposure, particularly when vesting schedules are short.
Private Investors Early investors may have different cost bases and incentives than public-market participants.
Ecosystem Allocation Ecosystem reserves can support growth but may also represent a large future source of supply.
Treasury Treasury ownership can provide financial resources while also creating centralized supply exposure.
Community Community distributions can improve decentralization, but distribution mechanisms matter.
Infographic of Crypto Trends 2026 shows How Bear Market Innovation Is Forging the Next Big Breakthrough

Analyze Holder Concentration

Token supply can appear widely distributed while still being heavily controlled by a small number of wallets.

Holder concentration analysis therefore asks a different question from allocation: who actually controls the circulating supply today?

Useful Concentration Metrics

  • Top 10 holders as a percentage of supply
  • Top 20 holders as a percentage of supply
  • Insider concentration
  • Foundation or treasury concentration
  • Large exchange-controlled balances
  • Wallet clustering where reliable data is available
Concentration can amplify market risk. If a small number of entities control a substantial amount of supply, their actions can potentially have an outsized effect on liquidity and market behavior.
Infographic of Tokenized US Treasuries Explained: Digital Government Bonds & Yield Markets in 2026

Why Tokenomics Metrics Should Not Be Analyzed Separately

The strongest tokenomics analysis connects multiple variables rather than treating each metric as an independent pass-or-fail test.

A
Low circulating supply

Creates potential future dilution exposure.

B
Large upcoming unlock

Increases the amount of supply that may become available.

C
High insider ownership

Creates additional concentration and potential distribution risk.

D
Thin liquidity

Can make large supply movements more difficult for the market to absorb.

This is where tokenomics becomes a risk framework. The objective is to understand how supply mechanics interact with market liquidity and ownership behavior.
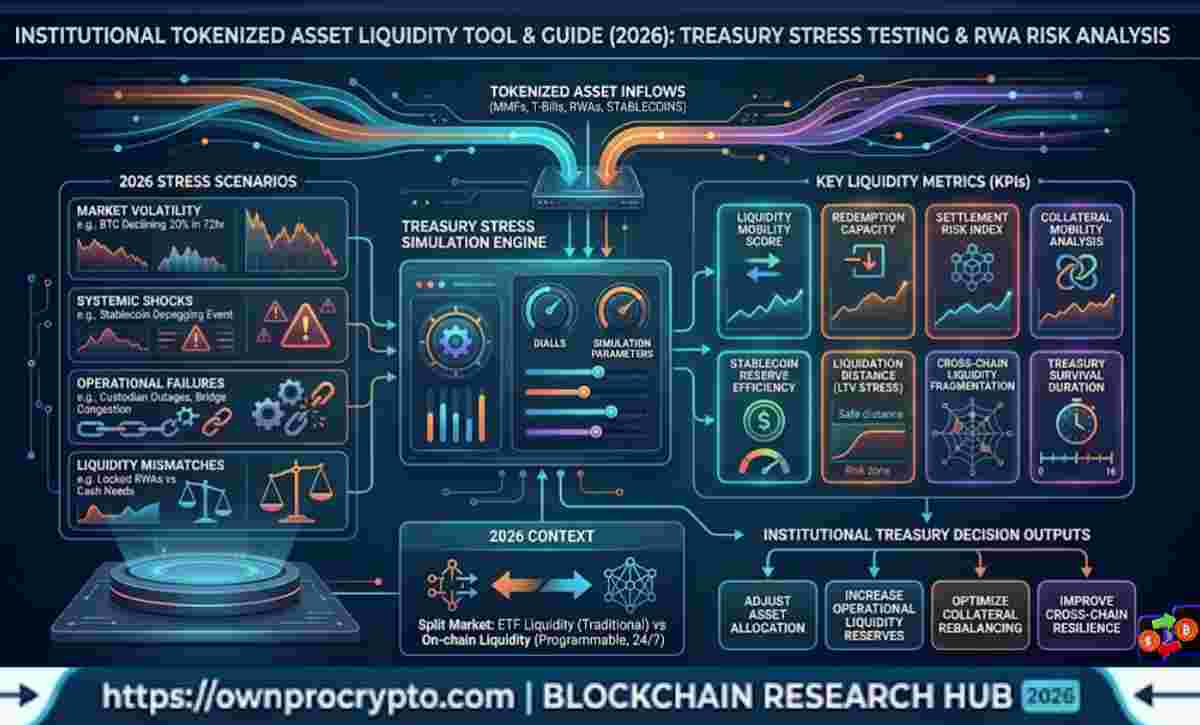
Infographic of Institutional Tokenized Asset Liquidity Tool & Guide (2026)

How to Build a Tokenomics Risk Score

A structured scoring system can make tokenomics analysis easier to compare across multiple assets.

Each component can be converted into a standardized risk score from 0 to 100, where lower values represent lower structural risk and higher values represent greater structural risk.

0–25 Low
26–50 Moderate
51–75 High
76–100 Critical

Illustrative Tokenomics Risk Formula

Tokenomics Risk = Dilution × 20% + Inflation × 20% + Unlocks × 25% + Allocation × 20% + Concentration × 15%
This weighting illustrates how a structured model can prioritize future supply pressure while still accounting for ownership and allocation risk.
Why use weighted scoring? It prevents one isolated metric from dominating the entire assessment and creates a repeatable framework for comparing assets.

Example: Comparing Two Tokenomics Profiles

Imagine two hypothetical tokens with similar market capitalizations. Their tokenomics may still produce very different structural risk profiles.

Token A · Illustrative

High circulating ratioMost of the stated supply is already circulating.
Low near-term unlocksLimited scheduled supply expansion.
Moderate concentrationLarge holders still require monitoring.

Token B · Illustrative

Low circulating ratio A significant amount of supply remains outside circulation.
Large upcoming unlocks Future supply expansion could materially change the supply profile.
High insider concentration A relatively small group controls a significant portion of supply.

The lesson is simple: market capitalization alone cannot describe tokenomics risk. Two assets with similar valuations can have completely different future supply dynamics.

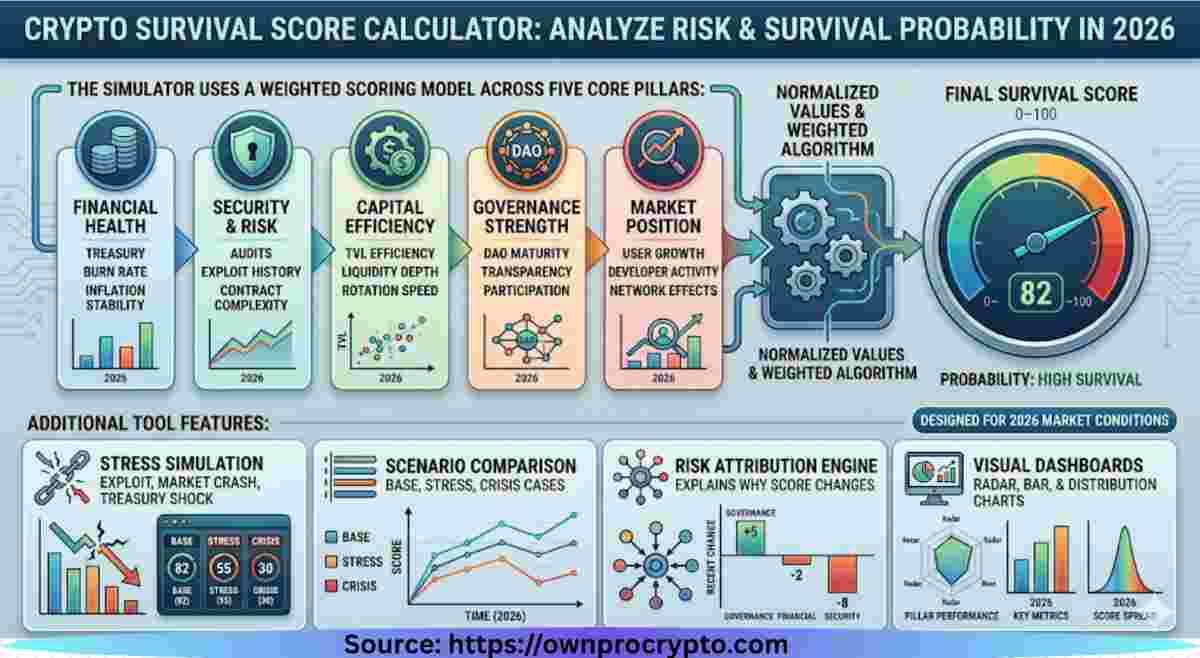
Infographic of Crypto Survival Score Calculator: Analyze Risk & Survival Probability in 2026

What Data Do You Need for a Tokenomics Analysis?

Before scoring an asset, collect the following information from reliable project documentation and market-data sources.

  • Current circulating supply
  • Total or maximum supply
  • Annual inflation or emission rate
  • Upcoming token unlock percentage
  • Vesting schedule
  • Investor allocation
  • Team and insider allocation
  • Treasury or foundation allocation
  • Top-holder concentration
  • Historical changes to the token supply
Infographic of Bitcoin Beginner Mistakes (99% of Beginners Do)

Common Crypto Tokenomics Analysis Mistakes

1. Looking only at maximum supply Maximum supply tells you the theoretical ceiling, not how supply is distributed or when remaining tokens may enter circulation.
2. Ignoring unlock schedules A token can appear supply-constrained today while having substantial future unlocks.
3. Treating all inflation as bad Inflation can serve legitimate network-security and incentive purposes. Analyze its economic role rather than judging the number alone.
4. Ignoring ownership concentration A reasonable allocation chart does not necessarily mean current ownership is decentralized.
5. Using one metric as the final answer Good tokenomics analysis combines several variables and looks for interactions between them.

How to Interpret the Final Tokenomics Picture

Once the individual metrics are collected, group the findings into structural conclusions rather than simply counting positive and negative points.

Lower structural pressure High circulating supply, manageable inflation, limited near-term unlocks and broad ownership can reduce certain supply-side risks.
Moderate structural pressure Some future dilution or concentration exists, but the overall supply schedule may remain manageable.
High structural pressure Multiple factors such as large unlocks, high inflation or concentrated ownership begin reinforcing each other.
Critical structural pressure Significant future supply expansion combined with concentrated ownership or weak market absorption can create a much more fragile structure.
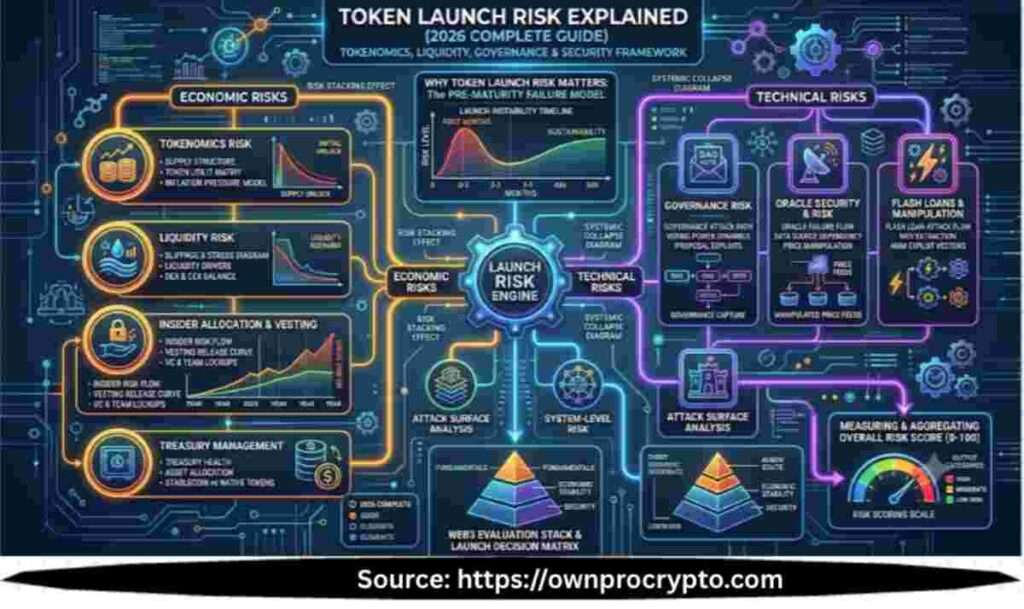
Infographic of Token Launch Risk Explained (2026 Complete with Token Launch Risk Simulator

Turn Tokenomics Research Into a Repeatable Risk Assessment

Manual tokenomics research is useful, but repeating the same calculations for multiple assets can become time-consuming.

A structured crypto risk analyzer can standardize the process by converting supply, inflation, unlock, allocation and concentration inputs into a consistent tokenomics risk profile.

Research → Inputs → Scoring → Risk Profile The objective is not to replace research. It is to make the interpretation of that research more consistent and easier to compare.

This approach is particularly useful when screening several cryptocurrencies and identifying which assets deserve deeper due diligence.

Crypto Tokenomics Analysis FAQ

What is the most important metric in tokenomics?

There is no single universally dominant metric. Circulating supply, future dilution, unlocks, inflation and concentration should be evaluated together.

Is a low circulating supply a risk?

It can be. If a large portion of total supply remains outside circulation, future releases may create dilution or additional market supply. The actual risk depends on the release schedule and recipients.

Are token unlocks always bearish?

No. An unlock changes the availability of supply, but the economic impact depends on who receives the tokens, their incentives and the ability of the market to absorb additional supply.

How does inflation affect crypto tokens?

Inflation increases token supply over time. If demand does not grow sufficiently to absorb new issuance, existing holders may face dilution.

Why is holder concentration important?

Concentrated ownership means a relatively small number of wallets or entities control a large amount of supply. Their actions can potentially influence liquidity, governance and market behavior.

Can tokenomics predict the future price of a cryptocurrency?

No. Tokenomics analysis describes structural supply and ownership conditions. Price also depends on demand, liquidity, market conditions, adoption, sentiment and many other variables.

What should I check before buying a crypto token?

Review circulating supply, future dilution, inflation, unlock schedules, allocation, holder concentration and liquidity. Then combine the tokenomics analysis with broader market, protocol and fundamental research.

Conclusion: Analyze the Supply Structure, Not Just the Token Price

A strong crypto tokenomics analysis looks beneath the current market price. It asks how many tokens exist, how many are circulating, how quickly supply can expand, who controls the tokens and what future events can change that structure.

The most useful framework combines five areas: supply, inflation, unlocks, allocation and concentration.

When these factors are evaluated together, tokenomics becomes more than a list of token statistics. It becomes a practical framework for understanding potential dilution, ownership and supply-side risk.

The core principle Do not ask only “How much is this token worth today?” Ask “How can the supply structure change, who controls it, and how might the market absorb that change?”

Ready to Analyze a Crypto Asset?

Use a structured risk assessment approach to evaluate tokenomics alongside other important dimensions such as market behavior, liquidity, protocol exposure and concentration.

A standardized risk fingerprint can help turn scattered crypto research into a clearer, repeatable assessment.

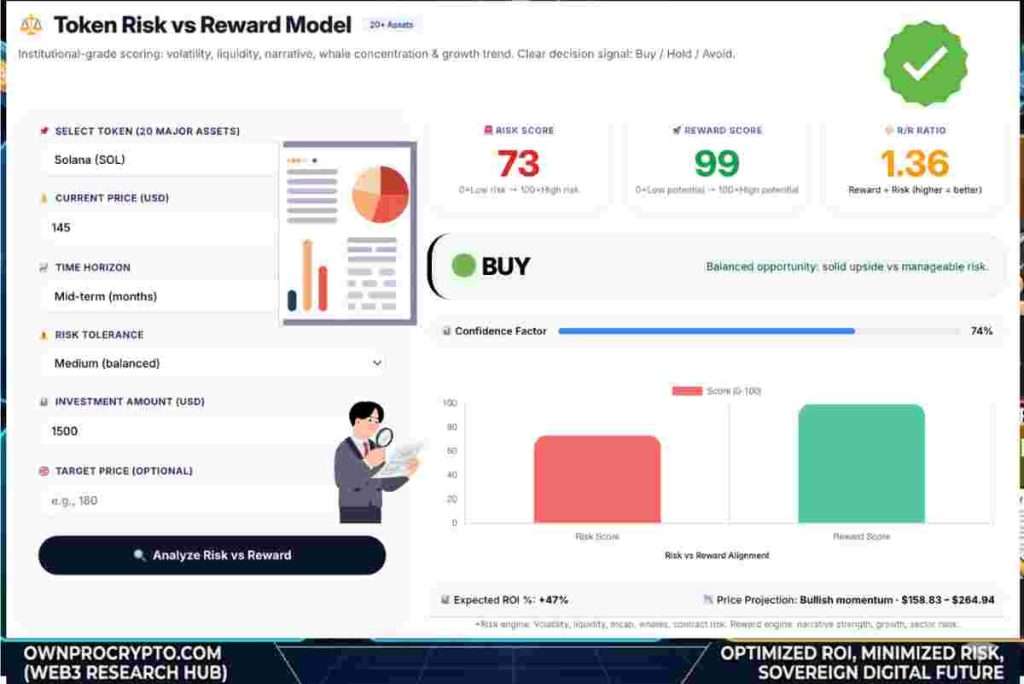
Infographic of Token Risk vs Reward Tool 2026
Token Risk vs Reward Tool

OwnProCrypto Resource Library

Tokenomics should be evaluated as one layer of a wider crypto research process. Use the following OwnProCrypto resources according to the question you are trying to answer.

Explain Tokenomics Explained

Understand how token supply, incentives and economic mechanisms work.

Evaluate Crypto Analysis Tools

Place tokenomics inside a broader cryptocurrency research framework.

Launch Risk Token Launch Risk

Examine launch-specific tokenomics, liquidity, vesting and insider risks.

Decision Tool Token Risk vs Reward Tool

Compare broader risk and reward factors after completing token research.

DeFi DeFi Protocol Analysis Guide

Evaluate protocol economics, adoption, yield and structural risk.

DeFi Risk DeFi Risk Analysis

Extend token research into smart-contract, governance and protocol risks.

Portfolio Crypto Portfolio Dashboard

Consider token exposure within a broader portfolio-risk context.

Advanced Portfolio AI Crypto Portfolio Tool

Analyze portfolio scenarios, allocation and broader risk factors.

External Tokenomics Research Sources

Token supply data can differ between providers. For serious research, verify important figures against primary protocol documentation, smart-contract data and established market-data methodologies.

Research rule

Use aggregators for discovery and comparison, but verify material tokenomics claims against the project’s own documentation, governance records, contract behavior or other primary evidence whenever possible.

Looking for another topic? Search the OwnProCrypto research archive.
Comments
💬 What’s Your Take? Leave a Comment Below 0
← Crypto Fundamental Analysis Guide 2026
RWA Tokenization Guide 2026: Institutional Architecture, Process, Risks & Adoption →
🛠 Explore Tools ▼
📚 Explore Crypto Research Select a research category