
Table of Contents
ToggleThe cryptocurrency market has entered a maturity phase that looks very different from previous cycles. During the 2017 boom, investors focused on token launches and exchange listings. During the 2021 cycle, attention shifted toward DeFi yields, NFT speculation, and rapid ecosystem growth. By 2026, the conversation has evolved again.
Investors, family offices, crypto funds, and institutional allocators are increasingly focused on one critical question:
Which projects can survive multiple market cycles?
Thousands of digital assets have launched over the past decade, yet only a small percentage remain relevant after enduring prolonged bear markets, regulatory shifts, liquidity contractions, exchange delistings, and technological disruption.
As capital becomes more selective, successful allocation depends less on chasing narratives and more on understanding historical resilience, network durability, ecosystem growth, and sustainable value creation.
This is where a structured crypto survivability framework becomes essential.
Rather than evaluating projects based solely on price performance, this framework measures the deeper characteristics that allow blockchain ecosystems to survive, adapt, and recover across multiple market environments.
| Metric | Why It Matters |
|---|---|
| Historical Survival | Measures resilience through multiple cycles |
| Developer Activity | Indicates ecosystem health |
| Liquidity Strength | Supports market stability |
| Real Yield Generation | Demonstrates economic sustainability |
| Community Growth | Signals long-term adoption |
| Exchange Support | Improves accessibility and liquidity |
| Governance Strength | Reduces protocol failure risk |
| Capital Efficiency | Maximizes sustainable growth |
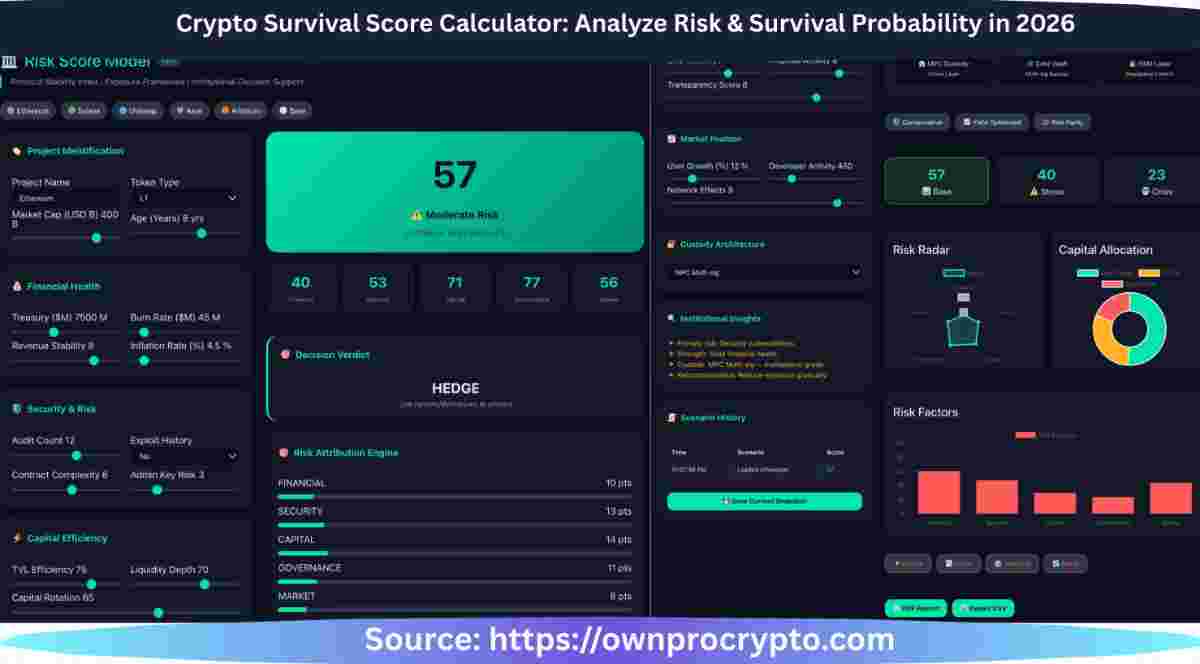
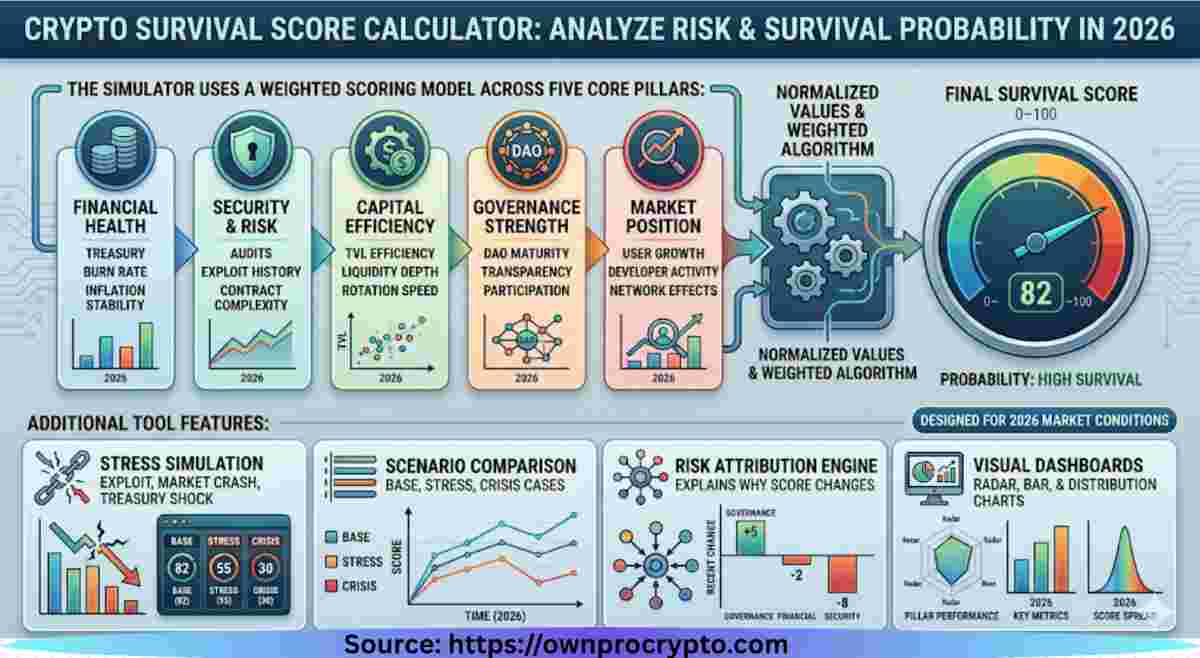
The simulator uses a weighted scoring model across five core pillars:
Each input is converted into normalized values and processed through a weighted algorithm to generate a final survival score between 0–100.
The tool also includes:
This makes the output not just a score, but a structured risk narrative.

The cryptocurrency industry has a severe survivorship bias problem.
Investors often remember:
But forget thousands of projects that disappeared entirely.
Many assets experienced:
The reality is simple:
A project does not need to be a scam to fail.
Many technically sound projects simply fail to attract enough users, developers, capital, or ecosystem activity to survive.
Understanding these risks is the foundation of effective crypto historical analysis and long-term portfolio construction.
The Crypto Survivability Framework is a multi-dimensional validation system designed to assess a protocol’s systemic resilience against market shocks, governance failures, and economic stress. It shifts the evaluation of digital assets from speculative upside to structural endurance by analyzing core operational pillars.
The framework evaluates every blockchain project across seven core dimensions.
Market Cycle Survival
          │
          ▼
Developer Activity
          │
          ▼
Network Adoption
          │
          ▼
Liquidity Strength
          │
          ▼
Revenue & Real Yield
          │
          ▼
Governance Quality
          │
          ▼
Capital Efficiency
          │
          ▼
Crypto Project Survival Score
The Project Survivability Architecture is an institutional-grade validation system engineered to stress-test tokenized assets, protocols, and digital frameworks against systemic failure. It shifts the analysis of digital assets away from speculative price action and targets structural endurance, risk attribution, and capitalization permanence under stress conditions.
Rather than viewing risk through a single variable, the architecture uses a multi-layered matrix to analyze real-time variables across five infrastructure vectors, generating a normalized, multi-dimensional profile of protocol longevity.
Market Cycle Survival measures a project’s capacity to endure systemic volatility, liquidity drains, and severe capital contraction phase transitions. Protocols surviving multiple cycles demonstrate robust treasury management, sustainable emission schedules, and a permanent baseline of holder conviction.
The first test is simple:
Has the project already survived a bear market?
Projects that endure multiple cycles often demonstrate stronger fundamentals than those that only exist during bullish conditions.
| Project | Launch | Survived 2018 Bear | Survived 2022 Bear | Active 2026 |
|---|---|---|---|---|
| Bitcoin | 2009 | Yes | Yes | Yes |
| Ethereum | 2015 | Yes | Yes | Yes |
| Solana | 2020 | N/A | Yes | Yes |
| Polygon | 2017 | Yes | Yes | Yes |
| Terra | 2018 | No | Failed | No |
Projects surviving multiple downturns generally exhibit stronger network effects and community resilience.

A blockchain without active development eventually stagnates.
Developer Activity serves as a leading indicator of network longevity, tracking active code commits, repository updates, and builder retention. Continuous engineering momentum ensures regular security optimizations, protocol updates, and the deployment of new ecosystem integrations.
| Metric | Healthy Range |
|---|---|
| Monthly Commits | Increasing |
| Active Contributors | Growing |
| Repository Updates | Frequent |
| Protocol Upgrades | Ongoing |
| Ecosystem Grants | Active |
Strong developer ecosystems often recover faster after market downturns.

Network Adoption gauges real-world utility by tracking active wallet growth, transaction volume velocity, and sustained user interactions. True adoption builds structural network effects that decouple a protocol’s survival from short-term market speculation.
| Protocol Health Tier | Weekly Active Wallets | Transaction Velocity |
| Tier 1 (High Survival) | Over 500,000 wallets | Greater than 25 tx/sec |
| Tier 2 (Moderate Risk) | 100,000 to 500,000 wallets | 5 to 25 tx/sec |
| Tier 3 (Fragile / High Risk) | Under 100,000 wallets | Less than 5 tx/sec |
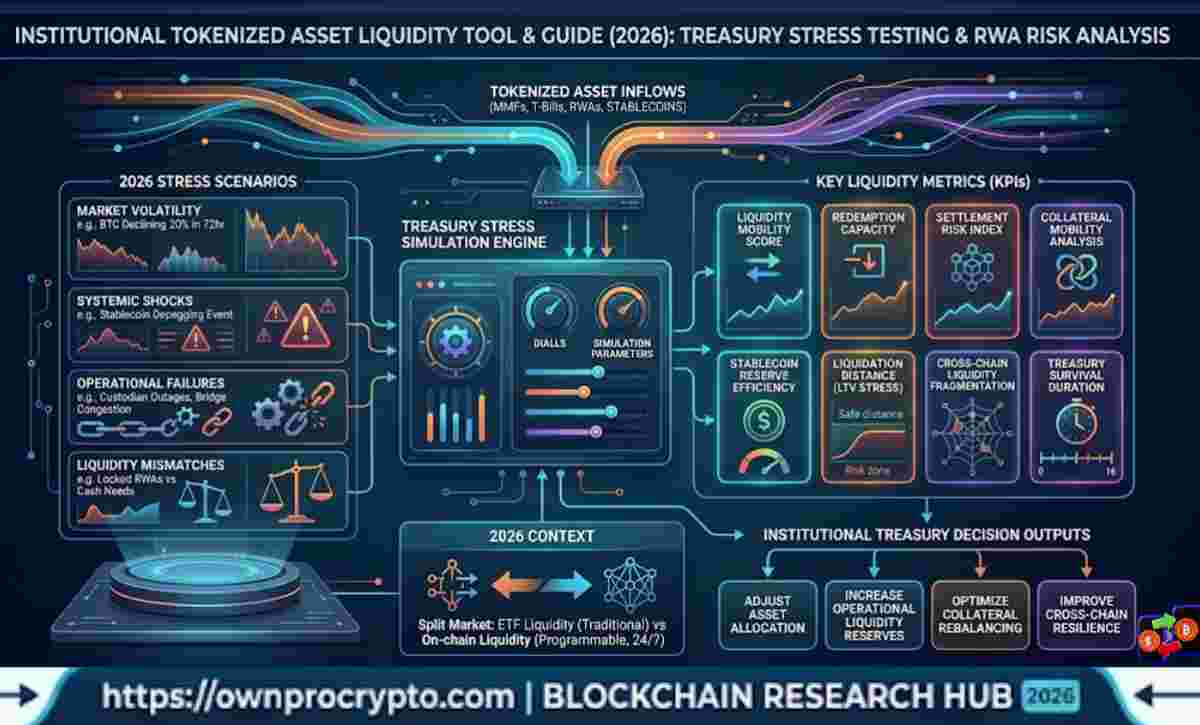
Liquidity Strength evaluates the depth, mobility, and fragmentation of a protocol’s capital reserves across decentralized and centralized venues. High liquidity depth mitigates severe slippage and prevents cascading liquidation events during market panics. Liquidity also determines whether investors can enter and exit positions efficiently.
Many failed projects maintained active communities while suffering liquidity collapse.
| Indicator | Low Risk | High Risk |
|---|---|---|
| Exchange Listings | 10+ | Under 3 |
| Daily Volume | High | Very Low |
| Market Depth | Strong | Thin |
| Institutional Access | Available | Limited |
| Stablecoin Pairs | Multiple | Few |
Liquidity remains a critical component of any professional blockchain project evaluation process.

One of the biggest lessons from the previous cycle is that not all yield is equal. Projects generating sustainable revenue differ significantly from those relying on token emissions.
Revenue and Real Yield analyze the economic sustainability of a protocol by measuring actual fees generated against token emissions. Sustainable ecosystems prioritize organic revenue generation over inflationary distributions to maintain long-term capital stability.
| Real Yield | Synthetic Yield |
|---|---|
| Transaction Fees | Token Inflation |
| User Activity | Incentive Farming |
| Sustainable | Temporary |
| Revenue Based | Emission Based |
| Long-Term Friendly | Speculative |
This distinction has become increasingly important as institutional investors prioritize sustainable cash flows.
Governance failures frequently destroy otherwise promising projects.
Governance Quality reviews the maturity, transparency, and wallet participation rates within a DAO infrastructure. Strong governance removes single points of failure, prevents signer collusion, and ensures secure, programmatic workflow upgrades.
Questions to evaluate:
Weak governance often precedes ecosystem decline.
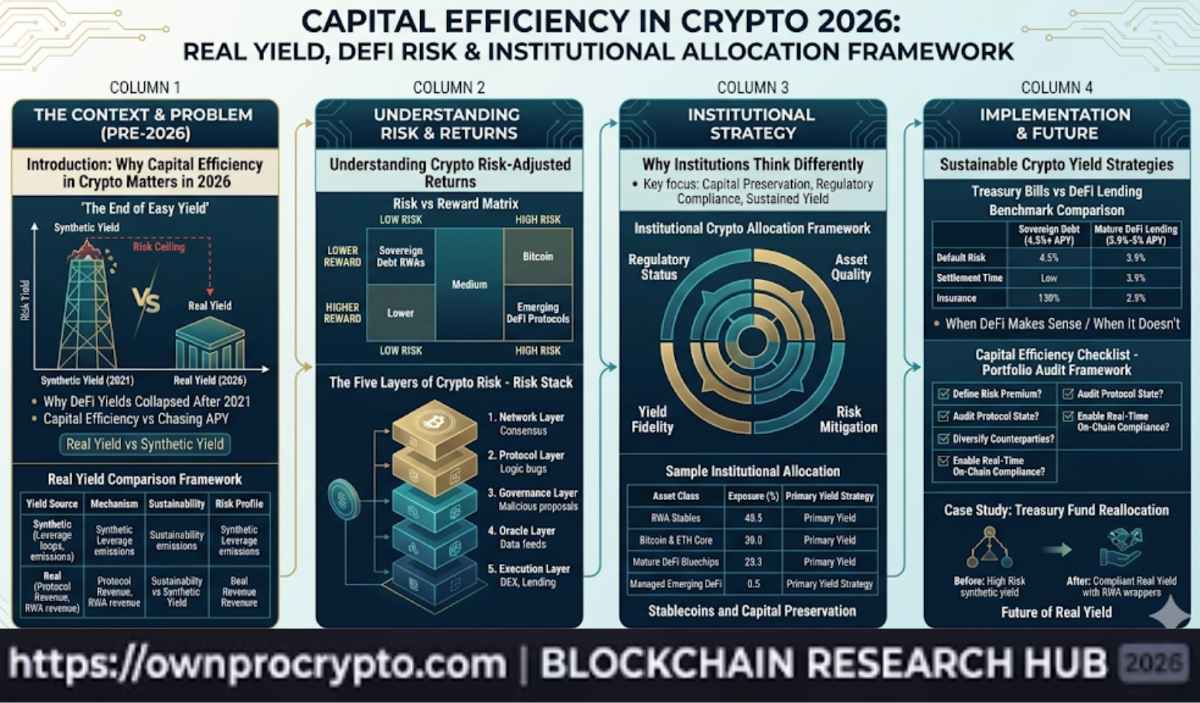
Capital efficiency has emerged as one of the most important themes in 2026. Capital Efficiency calculates how effectively a protocol utilizes its Total Value Locked (TVL) to maximize volume and throughput. High efficiency indicates fast capital rotation speeds, optimized collateral deployment, and minimal idle reserves.
The strongest projects allocate resources effectively while maintaining growth and resilience.
| Factor | Weight |
|---|---|
| Revenue Generation | 25% |
| Treasury Management | 20% |
| Ecosystem Growth | 20% |
| Developer Retention | 15% |
| User Retention | 10% |
| Liquidity Strength | 10% |
Efficient capital allocation improves survivability during extended downturns.
The Crypto Project Survival Score Model evaluates a project’s long-term sustainability by analyzing key fundamentals such as treasury strength, revenue generation, user adoption, token utility, security, governance, and capital efficiency. Each category receives a weighted score that contributes to an overall survival rating between 0 and 100. Higher scores indicate stronger resilience, healthier operations, and a greater likelihood of surviving market downturns, while lower scores may signal elevated financial, technical, or operational risks. This framework helps investors, researchers, and treasury managers make more informed project assessments using a structured, data-driven approach.
| Category | Weight |
|---|---|
| Historical Survival | 20 |
| Developer Activity | 15 |
| Liquidity Strength | 15 |
| Adoption Metrics | 15 |
| Governance | 10 |
| Revenue Quality | 15 |
| Capital Efficiency | 10 |
| Score | Interpretation |
|---|---|
| 90-100 | Exceptional Survivability |
| 80-89 | Strong |
| 70-79 | Moderate |
| 60-69 | Weak |
| Below 60 | High Risk |

Successful blockchains solve real problems.
Adoption metrics provide direct evidence of network utility.
| Metric | Importance |
|---|---|
| Active Wallets | User Growth |
| Transactions | Usage |
| TVL | Capital Attraction |
| DApp Count | Ecosystem Expansion |
| Enterprise Partnerships | Institutional Adoption |
Projects demonstrating consistent growth across these metrics typically score higher in crypto performance analysis models.
The most valuable lessons often come from failures.
| Failure Type | Example Outcome |
|---|---|
| Liquidity Collapse | Exchange Delisting |
| Token Inflation | Value Destruction |
| Governance Crisis | Community Exit |
| Security Breach | Treasury Loss |
| Developer Abandonment | Ecosystem Death |
Understanding these patterns strengthens future investment decisions.
Every market cycle follows a similar structure.
Innovation
     │
     ▼
Speculation
     │
     ▼
Euphoria
     │
     ▼
Correction
     │
     ▼
Capitulation
     │
     ▼
Survival
     │
     ▼
Recovery
The projects that survive the survival phase typically become leaders in the next cycle.
Many investors focus exclusively on performance.
Professional allocators focus on durability.
A project that survives:
has a greater probability of compounding value over time.
The goal is not simply finding the next pump.
The goal is identifying networks capable of creating value across multiple market cycles.
The digital asset industry is no longer defined by speculation alone. As markets mature, capital increasingly flows toward projects with demonstrated resilience, sustainable economics, active development, and measurable adoption.
The crypto survivability framework provides a structured approach for separating temporary narratives from durable blockchain ecosystems. By combining crypto historical analysis, crypto market cycle analysis, blockchain project evaluation, and crypto performance analysis, investors can build portfolios around projects with the highest probability of surviving future market cycles.
In an industry where thousands of assets compete for attention but only a small fraction endure, survivability may ultimately become the most valuable metric of all. Need deeper crypto research? Review professional blockchain analytics and network insights
A crypto survivability framework is a structured model used to evaluate whether a blockchain project can survive multiple market cycles based on adoption, liquidity, governance, revenue, and ecosystem strength.
Most projects fail due to weak adoption, poor tokenomics, governance issues, declining developer activity, or liquidity shortages.
A crypto project survival score measures long-term resilience using historical performance, ecosystem health, and financial sustainability metrics.
Developer activity is one of the strongest indicators of future growth because active development drives innovation and ecosystem expansion.
No. Many projects experienced strong short-term gains but ultimately failed due to structural weaknesses.
Liquidity helps maintain market stability and enables efficient trading during both bull and bear markets.
Crypto historical analysis examines how projects performed across previous market cycles, including drawdowns, recoveries, and adoption trends.
Real yield reflects sustainable economic activity rather than temporary token incentives, making it a stronger indicator of long-term viability.
Investors can evaluate projects through governance quality, adoption metrics, liquidity, developer activity, and revenue generation.
No single metric guarantees success, but projects combining strong adoption, sustainable economics, active development, and capital efficiency historically show the highest survivability rates.
Welcome to OwnProCrypto (Own & Pro Crypto) — a next-generation Bitcoin and blockchain education platform where the science of finance meets the power of AI-driven automation.
Our mission is simple: to equip you with the knowledge, frameworks, and tools needed to make smarter financial and business decisions in the Web3 economy.
Beyond analysis, OwnProCrypto focuses on transparency, verifiable data, and practical frameworks that investors and builders can actually use. Our goal is not hype — but clear thinking, disciplined analysis, and long-term value creation in the decentralized economy.
Our Background
Crypto Tools & Analysis:
Crypto Fundamental Analysis Tools | Protocol Evaluation System | DeFi Risk Analysis Tools | Crypto Portfolio Dashboard | Token Risk vs Reward Tool
Guides:
Crypto Fundamental Analysis | Blockchain Project Evaluation | Tokenomics Analysis | DeFi Protocol Analysis
© 2026 OwnProCrypto — Built for smarter crypto decisions