Infographic of Ownprocrypto OPC Logo for 2026 Web3 Ecosystem

Ownprocrypto:

Sovereign Asset Strategy & Web3 Institutional Research

The 2026 Gold & Silver Crash: Why Experts Are Warning Investors to Protect Physical Metals

Quick 5-Step Guide to Protecting Physical Metals in 2026

This infographic of 2026 Gold & Silver Crash Experts Are Warning Investors to Protect Physical Metals

The 2026 Gold & Silver Crash: News Updates

Table of Contents

As of April 1, 2026, global precious metals markets are facing heightened volatility, with gold and silver experiencing sharp corrections after record highs earlier this year. Analysts report that both metals suffered significant declines in March—gold dropped nearly 12%, marking its worst monthly performance since 2008, while silver also retreated after extreme price swings . Despite brief rebounds, experts remain cautious, warning that recent gains may only be temporary corrections following a broader downtrend of nearly 15% from peak levels . The unexpected weakness of traditional safe-haven assets during geopolitical tensions, including the ongoing Middle East conflict, has further shaken investor confidence, with gold even falling during periods when it typically rises.

Market strategists point to rising interest rates, a stronger U.S. dollar, and shifting investor behavior as key drivers behind the downturn, with some warning that the bull run may be nearing its end . As volatility continues and uncertainty persists, financial experts are increasingly advising investors to reassess their strategies and focus on protecting physical metal holdings rather than relying solely on speculative gains. Protecting physical wealth is a key component of the preservation strategies in our Legacy & Sovereignty (2026) guide. Track real-time metal deficits via the World Gold Council.

The January 31, 2026, “Flash Crash” proved that no asset is immune to a systemic liquidity rupture. While Gold and Silver were once seen as the ultimate “offline” refuges, the 2026 market is being reshaped by a shift toward Blockchain Sustainability Finance. As global liquidity tightens, the $7 trillion Japanese carry-trade unwind has forced institutions to liquidate physical holdings to satisfy margin calls, creating a temporary “dash for cash.” However, for the strategic investor, this volatility is the ultimate stress test for Transparent Impact Tracking. By integrating hard physical assets with Tokenized Impact Bonds and high-velocity Green Bond Blockchain frameworks, we can move beyond traditional “Paper Gold” traps. The goal is no longer just holding metal; it’s about utilizing ESG Data Tokenization to ensure your wealth has the Digital Survivability to thrive even when traditional markets freeze.

Watch Video:  breakdown of the $7 trillion Japanese bond market shift. It illustrates the exact “unwind” mechanics that force institutions to liquidate gold and silver to cover their traditional carry trade obligations.

The 2026 Gold & Silver Crash: Why Experts Are Warning Investors to Protect Physical Metals

The possibility of a major correction in precious metals markets is becoming a growing concern among analysts and institutional investors. As economic uncertainty, tightening monetary policies, and shifting global demand create volatility, some experts warn that both gold and silver prices could experience a sharp downturn in 2026. While paper markets and leveraged trading amplify risk, many seasoned investors argue that holding physical metals remains one of the most reliable ways to preserve wealth during market turbulence. In this environment, understanding the potential triggers behind a gold and silver crash—and how to safeguard tangible assets—has become more important than ever.

Bitcoin and Physical Assets: A Balanced Perspective

Is Bitcoin the future of wealth storage? If it is, why do we still protect physical metals like gold and silver? This post explores the historical context, current market realities, and a realistic strategy for investors.


Historical Lessons: Governments and Physical Assets

Governments have historically intervened to secure their treasuries by controlling or forcibly collecting valuable assets. This pattern offers insights for how digital assets like Bitcoin might behave in the future.

Forced Gold Collection: A Historical Proof Table

Era / Year Country Action Taken Purpose Outcome
1933 United States Executive Order 6102 forced citizens to surrender gold Strengthen federal treasury during Great Depression Citizens sold gold at set prices; federal reserves accumulated large gold stock
1940s India British colonial government collected gold and silver Finance wartime expenditures Wealth transferred to colonial treasury; local population restricted from owning gold
1960s UK Gold ownership regulated under government laws Control inflation and stabilize currency Citizens required to sell or store gold under government supervision
1970s USSR Gold collection campaigns from citizens Support state-controlled economy Gold centralized in state reserves; citizens restricted from private holdings

Observation: Governments often first create market pressure, then acquire assets for treasury strengthening. After initial resistance, citizens gradually shift to alternative assets.


Bitcoin: The Next Immutable Asset

Unlike physical metals, Bitcoin cannot be forcibly taken or altered by any single government. Its key features make it a potentially transformative store of value:

  • Decentralized: No single authority controls it.
  • Immutable: Transactions cannot be reversed or modified.
  • Scarce: Total supply capped at 21 million coins.

However, Bitcoin is not risk-free:

  • Regulatory actions (taxation, exchange restrictions) can affect usability.
  • Volatility remains high compared to traditional metals.
  • Loss of private keys or infrastructure risks exist.

Bitcoin vs. Gold: Macro Asset Rotation in 2026

In a 2026 macro liquidity reset scenario, asset rotation could be driven by real yields, central bank policy shifts, and global liquidity conditions. For example, if real yields rise sharply due to tighter monetary policy, institutional capital may temporarily rotate out of gold as holding non-yielding assets becomes less attractive. During the same period, risk appetite may compress, causing volatility in Bitcoin as leveraged positions unwind. However, once liquidity conditions stabilize and real yields peak, capital could rotate back into hard assets — with conservative investors favoring gold for stability, while higher-risk allocators increase exposure to Bitcoin for asymmetric upside. This type of rotation is not about one asset replacing the other, but about capital moving between stability and growth assets depending on macro pressure, liquidity cycles, and investor risk tolerance.


Safe Haven Asset Behavior Under Stress

During periods of systemic market stress, safe-haven behavior becomes clearly visible as capital rapidly rotates toward assets with proven scarcity, deep liquidity, and minimal counterparty exposure. Historically, gold and silver have fulfilled this role. In liquidity crunches, physical premiums often rise sharply as investors prefer direct possession over paper claims. Coin and bullion dealers frequently report inventory shortages during crises, pushing transaction prices above spot benchmarks.

At the same time, Bitcoin is increasingly viewed as a digital alternative safe haven. While centralized exchanges may experience congestion or temporary withdrawal delays during high volatility, Bitcoin’s on-chain settlement network continues to operate continuously, enabling peer-to-peer transfers without reliance on traditional banking infrastructure.

These patterns suggest a consistent structural response: during uncertainty, investors gravitate toward assets that combine scarcity, portability, and settlement finality. Whether through vaulted bullion or self-custodied Bitcoin, capital tends to seek instruments that preserve liquidity and sovereign control when conventional financial systems face stress.


Gold and Silver Physical Premiums Spiking During Liquidity Crunches

In crisis environments, the divergence between paper and physical pricing often widens. As demand for tangible metal increases, dealers may raise premiums due to supply constraints, logistics disruptions, or elevated wholesale costs. This premium expansion reflects a market preference for direct ownership over derivative exposure, particularly when counterparty trust weakens.


Bitcoin’s On-Chain Liquidity vs. Exchange Congestion

Bitcoin’s market structure differs from traditional metals markets. During volatility spikes, centralized exchanges can face heavy traffic, margin liquidations, or operational slowdowns. However, the underlying blockchain continues processing transactions independently of exchange platforms. Investors holding self-custodied Bitcoin retain the ability to transfer value globally, illustrating the distinction between exchange liquidity and protocol-level settlement.


AI-Informed Market Analysis: Practical Strategy

Based on historical patterns, current market conditions, and technological realities, an AI-informed approach suggests balanced protection, rather than betting solely on one type of asset.

Asset Protection Overview

Asset Type Purpose Risk / Reward Protection Strategy
Gold/Silver Stability, safe-haven Low volatility, moderate returns Secure storage, insurance, diversification
Bitcoin Future-proof digital store of value High volatility, high potential reward Cold wallets, partial exposure, long-term holding

Likely Scenario:

  1. Governments may initially regulate or restrict Bitcoin usage.
  2. As physical assets become harder to acquire or manage, adoption of Bitcoin may increase.
  3. Gradually, Bitcoin could become a mainstream digital store of value, but this will take time and likely coexist with physical assets.

AI Note: This evaluation is based on historical patterns, market dynamics, and technological properties of Bitcoin. It is not investment advice nor hype, but an informed perspective for investors to consider risk, diversification, and long-term trends.

Macro Liquidity Drivers Behind the 2026 Gold & Silver Crash

Understanding Macro Liquidity Science

Central banks injected and withdrew record liquidity within 90 days in 2026.

Gold and silver act as a leading indicator of liquidity stress.

Gold doesn’t react to headlines — it reacts to liquidity.

When leveraged positions unwind, physical markets may temporarily diverge from paper instruments. Institutional investors track:

  • Real yields
  • Margin call triggers
  • Synthetic supply expansions
  • Capital efficiency shifts

liquidity stress → forced liquidation → metals repricing → wealth protection

This infographic of Real Yield 2026: 3 Pillar of a Real Yield

Real Yields and Capital Rotation Pressure

Real yields swung aggressively in 2026, pressuring metals markets.

Gold historically has an inverse relationship with real yields (10Y Treasury yield minus inflation).

Real yields, not inflation headlines, dictate gold’s real direction.

When real yields rise:


    • Bonds become more attractive

    • Gold pricing pressure increases

    • Institutional flows rotate toward yield-bearing instruments


Precious Metals Dynamics impacted by Real Yield 

A 1% shift in real yields historically triggered major reallocations.

Real yields reflect both monetary policy and inflation expectations.

A 1–2% rise in real yields can create temporary headwinds for gold, especially during leveraged positioning reversals.

Real Yield vs. Gold Performance

Year 10Y Treasury Yield Inflation Rate Real Yield Gold Trend
2008 3.7% 3.8% -0.1% Strong rebound
2013 3.0% 1.5% +1.5% Gold decline
2020 0.9% 1.4% -0.5% Gold surge
2022 4.2% 8.0% -3.8% Volatile
2026 4.5% 3.0% +1.5% Short-term pressure

Gold competes with real yield — not nominal yield.

Historically, gold weakens when real yields rise sharply. However, once liquidity stabilizes, metals often recover as monetary policy pivots.

This infographic of Real Yield vs Gold Performance 2026

Historical Real Yield vs. Gold Performance

Period 10Y Yield Inflation Real Yield Gold Reaction
2008 3.7% 3.8% -0.1% Gold fell then doubled
2020 0.9% 1.4% -0.5% Gold surged
2026 4–5% ~3% +1–2% Gold repriced lower

Rising real yields create short-term headwinds—but historically, during systemic stress, gold rebounds once liquidity stabilizes.


Key Indicators for Tactical Accumulation of Metals

Liquidity indicators flipped three times in six months.

Investors should track:

  • 10Y TIPS vs. Treasury yield spreads
  • Central bank forward guidance
  • Macro liquidity stress signals
  • Global FX volatility

The best accumulation windows appear when fear peaks but liquidity stabilizes.

These indicators guide tactical accumulation or defensive positioning in physical metals.

infographic of The Japan Carry Trade Unwind 2026

Global Liquidity Stress 

The Japan Carry Trade Unwind (Trade and Private Credit Compression)

Currency volatility triggered rapid deleveraging across global markets.

For over a decade, global funds borrowed Japanese yen at near 0% and invested in higher-yielding US assets.

In 2026:

  • BOJ rate hikes reached ~0.75%
  • Forward guidance signaled further normalization
  • Yen volatility increased

When the carry trade unwinds, liquidity disappears fast.

Carry trades began unwinding, pressuring global liquidity and impacting leveraged positions.


Mechanics of the Carry Trade Liquidation

Steps include:

  1. Borrowing cheap yen → leverage increase
  2. Investing in US equities/bonds → asset inflation
  3. BOJ raises rates → borrowing costs rise
  4. Yen strengthens → positions reverse
  5. Assets sold → global liquidity tightens


Step-by-Step  Mechanics 

Step Effect
Borrow cheap yen Leverage increases
Invest in US assets Asset inflation
BOJ raises rates Borrowing cost rises
Yen strengthens Positions reverse
Assets sold Global liquidity tightens

Metals as Liquid Outlet

Gold volumes spiked during currency dislocations.

During unwind cycles:

  • Funds sell highly liquid assets first (treasuries, equities, gold futures)
  • Physical gold often remains stable or spikes in premiums
  • Investors with allocated holdings gain structural advantage

Gold becomes liquid when liquidity elsewhere vanishes.


Private Credit Market Compression

Private credit spreads widened sharply in 2026.

The private credit market expanded significantly post-2020. Hidden leverage and floating-rate debt create stress when rates remain elevated. Liquidity compression forces:

  • Cross-asset liquidation
  • Collateral sales
  • Cash hoarding

Private credit stress doesn’t stay private for long.

Gold often becomes collateral rather than conviction.

Key Indicators of Private Credit Market Stress

  • Fund redemption gates
  • Mark-to-model valuation gaps
  • Liquidity mismatches in institutional portfolios

How Private Credit Stress Influences Gold and Silver Demand

Periods of credit stress historically align with gold demand surges.

Credit fear feeds hard-asset demand.

  • Physical holdings provide insurance against margin squeezes
  • Diversification into metals offsets counterparty concentration
  • Retail and institutional buying can spike premiums in stressed periods

The 2026 Liquidity Reset Has Already Begun

In early 2026, more than $3 trillion rotated through after-hours markets as rising real yields, tightening margin requirements, and leveraged positioning unwinds triggered synchronized declines across gold, silver, equities, and crypto. This was not isolated volatility — it was capital being repriced across funding markets. When multiple asset classes move in correlation during stress, it signals a liquidity regime transition rather than a single-asset correction.

Market Structure & Forced Liquidation Risks

CME Margin Requirement Hikes

Margin requirement adjustments triggered cascading position closures.

Margin hikes during volatility accelerate forced selling. When exchanges raise collateral requirements:

  • Leveraged traders must post cash
  • Insufficient liquidity triggers margin call liquidation


Margin hikes don’t cause crashes-they expose leverage.

This pattern contributed to sharp, short-duration metal price declines in 2008, 2020, and 2026.

Understanding the Impact of Margin Requirement Hikes

  • Futures traders adjust positions rapidly
  • Short-term paper supply can exceed physical demand
  • Premiums for immediate delivery surge


Strategic Takeaways for Investors During Margin Adjustments

  • Avoid excessive leverage in ETFs/futures
  • Maintain allocated holdings to reduce counterparty dependency
  • Monitor CME announcements and stress scenarios


Futures vs. Physical Metals Dynamics

Paper gold volumes exceeded physical supply multiples.

The COMEX futures market allows leverage far exceeding physical inventory. This synthetic supply can temporarily suppress spot prices while demand for physical delivery remains firm.

Synthetic supply can suppress price — but not eliminate scarcity.

Market Type Backed By Leverage Settlement
Futures Contracts High Mostly cash
ETFs (Unallocated) Custodian pools Moderate Share-based
Allocated Physical Specific bars None Direct ownership

Short-term suppression occurs when futures volumes overwhelm physical delivery demand.

  • Paper instruments dominate liquidity but can diverge from physical demand
  • Retail premiums rise during stress even when futures prices drop
  • Synthetic supply amplifies volatility during margin-driven events.

Institutional Risks in Futures and Synthetic Markets

  • High leverage increases forced selling likelihood
  • Counterparty exposure grows in unallocated instruments
  • Allocated physical holdings minimize systemic risk

Volatility vs. Forced Liquidation Risks in 2026

Leveraged funds unwound billions in positions during sudden margin cascades.

Healthy corrections occur when speculative positioning is overextended. Forced liquidation happens when leverage meets margin compression. Recognizing the difference is critical.

Forced liquidation creates price distortion — and distortion creates opportunity.

Characteristic Healthy Correction Forced Liquidation
Selling Type Profit-taking Margin calls
Trigger Overbought Liquidity shortage
Duration Gradual Sharp, fast
Cross-Asset Impact Isolated Broad-based
Physical Premiums Stable Often rise

The 2026 decline showed cross-asset stress, margin hikes, and high after-hours volatility—signals more aligned with liquidity compression than normal correction cycles.


Forced Liquidation Indicators for Gold and Silver

ETF outflows spiked while retail coin demand hit multi-year highs.

Key triggers for forced selling include:

  • Rising real yields
  • CME margin requirement hikes
  • Sharp carry trade unwinds
  • Liquidity compression in private credit market

When paper sells and physical tightens, the market is signaling stress.

These signals often precede physical premium spikes and paper-gold divergences.

Volatility & Physical Premiums During Market Stress

Retail premiums widened significantly during liquidity events.

Premium spikes are the market’s way of pricing distrust.

During historical stress (2008, 2020), spot prices fell while retail premiums spiked and delivery times extended. This reflects paper market stress, not falling physical demand.


Physical Premium Spikes as Market Stress Indicators

  • Premium divergence signals forced liquidation
  • Acts as a market liquidity thermometer
  • Guides tactical accumulation timing for investors

Securing Physical Metal During Volatility

  • Prioritize allocated storage
  • Diversify storage locations
  • Track premium trends as early warning signals
This infographic of 2026 Gold & Silver Crash where Experts Are Warning Investors to Protect Physical Metals

Institutional vs. Retail Positioning During the 2026 Crash

Institutions reduced futures exposure while retail buyers accumulated physical metal.

Institutions typically exit paper markets first, leveraging futures and ETFs.

Institutions trade volatility — individuals survive it.

Retail investors often face elevated premiums and delivery delays. Understanding behavioral differences helps optimize accumulation and storage strategies.

Why Institutions Prefer Paper

Large funds maintain majority exposure through derivatives.

From a capital efficiency standpoint:

  • ETFs are easier to trade
  • Futures allow high leverage
  • Centralized custody simplifies reporting

Paper offers flexibility — physical offers certainty.

Physical ownership reduces counterparty exposure but lowers capital velocity.


Trade-Offs Between Paper and Physical Holdings

  • Paper: liquidity, leverage, short-term trading
  • Physical: security, insurance, long-term hedge

Long-Term Implications of Paper Dominance for Investors

  • Maintain a mix of allocated metals and high-liquidity instruments
  • Evaluate counterparty concentration
  • Monitor regulatory developments impacting RWA and collateral

Identifying Investors Who Should Prioritize Physical Assets in 2026

High-net-worth investors increased physical allocations by double digits in Q1 2026.

In unstable cycles, physical ownership separates preservation from speculation.

Investors exposed to highly leveraged assets, including hedge funds, private credit, and ETFs, should evaluate physical holdings. This includes:

  • Family offices seeking liquidity insurance
  • Wealth managers optimizing cross-asset allocations
  • Treasury teams mitigating systemic risk exposure
This Infographic of Gold Silver Asset Risk 2026: Chart shows Assets Risk of 2026

Gold Price Forecast 2026: Structural Shifts and Accumulation Trends

In recent years, structural shifts have transformed how gold and silver are accumulated, tokenized, and integrated into digital portfolios. Traditional ownership via physical bars and coins is increasingly complemented by tokenized precious metals, allowing fractional, on-chain ownership with near-instant settlement and global accessibility. This evolution reflects broader trends in sovereign portfolio design, where investors combine physical scarcity with digital liquidity, enabling more efficient hedging, arbitrage, and treasury management. Institutions are also leveraging these tokenized assets to diversify reserves, optimize capital allocation, and respond rapidly to shifts in market demand or macroeconomic stress.


Gold Accumulation Trends

The primary chart illustrates two decades of official sector gold accumulation, highlighting a massive structural shift. Between 2010 and 2021, central bank purchases averaged roughly 473 tonnes per year. However, the data from 2022 to 2026 shows an aggressive escalation, with annual totals surging toward 1,000+ tonnes. This movement suggests that global institutions are prioritizing “On-Chain Compliance” and physical reserves over fiat-based debt instruments.


The Great Decoupling: Gold vs. Real Yields

Historically, gold prices moved inversely to real yields. This infographic highlights “The Great Decoupling,” where gold has broken away from these “Old Rules.” Since 2022, gold prices have risen despite fluctuating yields, signaling that the market is valuing gold more as a systemic insurance policy than a mere interest-rate-sensitive asset. This shift is a core component of modern Capital Efficiency, as investors seek assets that perform independently of traditional monetary policy.


PGM Divergence: Platinum vs. Palladium

The Platinum Group Metals (PGM) sector shows a distinct divergence. Platinum has carved a path toward the $1,600/oz mark, outperforming Palladium, which has faced a steeper decline toward $1,200/oz. This “Three Metals, Three Paths” analysis suggests that industrial shifts—likely in automotive catalysts and green energy—are favoring Platinum’s recovery over its sister metals.


Silver Volatility and Liquidity Risk During Market Stress

During periods of market stress, silver exhibits heightened volatility and acute liquidity risk, often more pronounced than gold due to its smaller market size and thinner trading volumes. These conditions amplify physical premiums, as demand for verified, deliverable silver outpaces supply, creating temporary dislocations between paper contracts and physical bullion. Investors holding physical silver may face price spikes or delays in settlement, while ETFs and tokenized silver products can experience premium compression or liquidity bottlenecks.

Example: In early 2026, a surge in industrial demand combined with trading disruptions caused spot silver prices to temporarily trade 3–5% above futures contracts, highlighting how market stress directly impacts physical asset holders. For portfolio managers, these dynamics underscore the importance of on-chain tracking, inventory verification, and hedging strategies to navigate volatility while preserving sovereign asset continuity.


Silver’s Extreme Journey and Visual Drain

The analysis focuses heavily on the “Silver Deficit,” characterized by a “Deep Red” continued drain on global stocks from 2022 through 2025. This visual drain is paired with the “Gold/Silver Ratio’s Extreme Journey,” which has seen a significant “Compression” toward the 70-80 range. With silver stocks projected to hit critical lows by 2026, the industrial and investment demand continues to outpace mine supply, creating a tight market environment.

Tactical Allocation & Wealth Preservation

Investors without liquidity buffers were forced sellers in 2026.

Liquidity planning prevents emotional liquidation.

Maintain 6–12 months of liquid cash to avoid forced selling during market stress. Position metals as a strategic reserve, not speculative trade.

  • Set minimum liquidity thresholds
  • Hold metals in multiple jurisdictions
  • Use cash-metal ratios to avoid margin risk

  • Rising real yields beyond historical stress levels
  • Margin requirement spikes
  • Extreme carry trade unwind activity

Tactical Accumulation Strategy

Market conditions rarely remain static. Tactical accumulation involves buying metals or digital assets in phases rather than all at once, using clear indicators such as price dips, physical premiums, or macro stress events. By monitoring volatility, premiums, and liquidity pressures, investors can accumulate strategically, reducing risk while positioning for potential upside. Patience and discipline are key — the aim is to optimize entry points, not chase short-term gains.

  • Strategic buyers increased exposure during sharp corrections.
  • Accumulation requires discipline when headlines scream panic.

Scale into metals gradually. Buy during margin-driven spikes, avoid leverage, and use scenario-based triggers.

  • Dollar-cost averaging during premium spikes
  • Monitor CME margin announcements and real yield shifts
  • Adjust allocations according to risk tolerance

Avoiding Emotional Reactions During Market Stress

  • Maintain predefined thresholds
  • Avoid panic buying during short-term volatility
  • Follow structured accumulation plans

Insurance vs. Speculation

Gold serves as portfolio insurance against systemic instability, not short-term trading.

Physical metals are insurance — not a lottery ticket.

Gold serves as portfolio insurance against systemic instability, not short-term trading.

Defining Physical Metals as Portfolio Insurance

  • Hedge against banking stress and systemic liquidity risk
  • Preserve purchasing power
  • Provide intergenerational wealth protection

Separating Speculation from Strategic Hedging

  • Limit exposure to leveraged instruments
  • Maintain core insurance allocation in allocated physical metals

Securing Physical Metals

Physical metals remain one of the most reliable stores of wealth, especially during periods of market volatility or liquidity stress. Investors should focus on secure storage, including insured vaults, allocated accounts, or reputable custodians. Avoid keeping large amounts at home without proper protection, as theft or misplacement can undermine your portfolio. The goal is not just ownership, but accessible and protected ownership.


Diversification & Wealth Preservation

No single asset can eliminate risk. Combining physical metals, Bitcoin, and other financial instruments helps spread exposure across uncorrelated assets, balancing stability with growth potential. Diversification also extends to jurisdictions and custody methods, reducing systemic and regulatory risks. A well-diversified portfolio allows investors to preserve wealth across different market scenarios, from liquidity crises to inflationary pressures.

Diversification Beyond Metals

Multi-asset portfolios showed stronger drawdown resistance.

Diversification isn’t about returns -it’s about survival.

Balanced exposure may include:

  • Energy commodities
  • Agricultural products
  • Short-duration Treasuries
  • Cash equivalents


Building a Diversified Crisis-Resistant Portfolio

  • Combine safe-haven metals with liquid assets
  • Hedge across asset classes and geographies
  • Avoid overconcentration in any single instrument

Structural Shifts & Tokenization & Market

Capital Efficiency Pressure

Tokenized assets surpassed trillion-dollar market cap territory.

Illiquidity destroys optionality — even when net worth is high.

A newer dynamic in 2026 is the rise of Real-World Asset (RWA) tokenization. Tokenized treasuries and on-chain compliance frameworks increase:

  • Capital efficiency
  • Regulatory transparency
  • Institutional preference for yield-bearing instruments

Tokenization increases efficiency — but it doesn’t eliminate systemic risk.

This puts relative pressure on non-yielding physical metals, influencing allocation velocity without reducing long-term demand.

Tokenized assets compete with physical gold by:

  • Offering instantaneous liquidity
  • Providing yield in digital form
  • Meeting institutional reporting standards


Implications on Physical Metals Holdings

Digital capital rotation accelerated away from traditional safe havens.

Physical metal holders must evaluate:

  • Opportunity cost of unallocated cash
  • Liquidity vs. ownership trade-offs
  • Maintaining strategic buffer to avoid forced selling

Digital innovation changes access — not the need for tangible reserves.

Gold & Silver Price Forecasts and ROI Analysis

(Midpoint-Based Estimate)

To normalize the ranges, monthly midpoints were calculated for ChatGPT, Gemini, and AI Ave. Forecast, then averaged to create a blended monthly estimate.

Historical volatility and interest rate policy remain key risk factors that could materially alter these projections.

Comparison (2025–2026)

Gold Price Forecast Range (USD per oz) – 2025–2026
Month ChatGPT Gemini AI Ave. Forecast Avg. Gold Price
Dec-25 3700–4650 4150–4400 3984–4464 $4,301.00
Jan-26 3750–4700 4100–4350 4028–4500 $4,734.00
Feb-26 3800–4800 4200–4450 4120–4616 $4,800.00
Mar-26 3925–4925 4250–4550 4215–4745 $4,435.00
Apr-26 3975–5000 4300–4600 4249–4790 $4,486.00
May-26 4060–5200 4350–4700 4318–4900 $4,588.00
Jun-26 4145–5325 4400–4800 4369–4965 $4,667.00
Jul-26 4200–5375 4350–4750 4430–5035 $4,690.00
Aug-26 4250–5450 4450–4850 4544–5160 $4,784.00
Sep-26 4299–5525 4500–4900 4596–5235 $4,842.00
Oct-26 4340–5600 4550–5000 4694–5384 $4,928.00
Nov-26 4340–5600 4600–5100 4718–5415 $4,962.00
Dec-26 4340–5600 4700–5200 4728–5412 $4,742.00

Summary Metrics

  • Start (Dec-25 Blended): $4,225
  • End (Dec-26 Blended): $4,997
  • Projected 12-month increase: +$772
  • Estimated ROI:18.3%

Trend Observation

  • The blended midpoint rises from $4,225 (Dec-25) to $4,997 (Dec-26).
  • This represents a projected increase of approximately $772 per ounce over 12 months.

Estimated ROI (Dec-25 to Dec-26)

ROI = (4997 − 4225) / 4225 = 772 / 4225 = 0.1827 = 18.3%

Implied 12-month projected return: ~18%


Correlation Insight

All three forecast models show:

  • Consistent upward monthly adjustments
  • Narrowing divergence in mid-year
  • No projected downward phases

This produces a very strong positive directional correlation between the models (near-perfect trend alignment). In simple terms, the models move in the same direction throughout the period, indicating consensus on gradual upward price bias rather than volatility-driven swings.

Historical Liquidity Events & Lessons for 2026

Liquidity crises rewrite wealth hierarchies. Historical liquidity shocks reshaped asset allocations for years 2008, 2020, and the 2026 Replay

Year Trigger Gold Initial Move 12-Month Outcome
2008 Financial crisis -30% +150%
2020 COVID liquidity shock -15% New ATH
2026 Rate pressure + carry unwind -10–30% TBD

Gold historically falls during the liquidity grab phase, then rebounds during stabilization.


Learning from Historical Liquidity Shocks in Gold and Silver

  • Compare cross-asset responses
  • Track margin compression events
  • Use historical analogues for tactical accumulations

Gold & Silver Crash Comparison Table

Metric 2008 Financial Crisis 2020 COVID Shock 2026 Liquidity Reset
Primary Trigger Banking collapse Global shutdown Rate pressure + carry unwind
Initial Gold Drop ~ -30% ~ -15% ~ -10% to -20%
Initial Silver Drop ~ -50% ~ -35% ~ -25% to -35%
Real Yield Direction Falling sharply Deep negative Rising positive
Margin Hikes Yes Yes Yes
Liquidity Stress Extreme Extreme Elevated
Physical Premiums Spiked Spiked Rising
12-Month Gold Outcome +150% New ATH TBD (stabilizing phase)
Policy Response QE1 Unlimited QE Potential rate pivot
  • Monitor real yields, CME margins, and FX volatility
  • Prioritize liquidity buffers
  • Allocate physical holdings before forced selling occurs
Infographic of Legal Regulatory & Compliance Risk in Blockchain & Web3 in 2026

Custody, Counterparty Risk, and Asset Protection

Gold Confiscation of 1933

Policy risk has historically followed financial instability.

Executive Order 6102 required private gold surrender, following dollar devaluation.

History shows that monetary stress invites policy response.

Modern risks in developed markets are lower but may manifest as:


    • Transaction reporting mandates

    • Capital movement restrictions

    • Withdrawal limits during banking stress


Historical Precedent and Modern Policy Implications


    • Confiscation unlikely in US today

    • Regulatory and capital control risk exists globally

    • Understanding jurisdictional exposure is critical for institutional investors


Strategies to Safeguard Assets


    • Offshore vaulting in politically stable jurisdictions

    • Allocated storage with serial-numbered bars

  • Maintain transparent compliance documentation

Counterparty Risk

Major financial failures have erased billions overnight.

If you don’t hold it, you depend on someone who does.

ETF shareholders own shares, not bars. Storage types:

Storage Type Counterparty Risk Transparency
ETF Moderate High liquidity
Unallocated Higher Lower clarity
Allocated Low High clarity
Personal custody None Security responsibility

Evaluating Custodial and Counterparty Risks in 2026


    • Choose allocated storage for long-term holdings

    • Monitor custodian solvency and regulatory environment

    • Consider insurance and auditing for additional protection


Minimizing Exposure to Unallocated Paper Instruments


    • Reduce reliance on unallocated ETFs

    • Avoid rehypothecation chains

  • Combine physical with liquid cash buffers

Scenario-Based Wealth Protection

Long-Term Wealth Preservation in a Liquidity Reset Era

  • Reducing Banking System Exposure
  • Systemic stress raised renewed questions about counterparty risk
  • The safest asset is the one without a counterparty

Strategies include:

  • Allocated vault storage
  • Jurisdictional diversification
  • Avoiding rehypothecation chains

Counterparty-Free Asset Protection Strategies

  • Minimize reliance on bank-held accounts
  • Use physical delivery options for critical holdings
  • Combine with short-duration liquid assets for flexibility

Jurisdictional Diversification for Wealth Preservation

  • Spread holdings across stable regions
  • Consider geopolitical, regulatory, and liquidity risks
  • Monitor international custody regulations

Institutional vs. Retail Diversification Approaches

  • Institutions favor yield-bearing alternatives alongside physical metals
  • Retail investors should focus on simplicity and insurance

Intergenerational Wealth Strategy

Multi-generational wealth planning surged amid volatility.

Wealth preservation isn’t quarterly — it’s generational.

Physical ownership:

  • Removes digital counterparty risk
  • Creates tangible inheritance assets
  • Preserves purchasing power across cycles

Scenario Description Gold Impact
Base Case Slow deleveraging, moderate cuts Gradual recovery
Stress Case Sovereign debt pressure escalates Strong rally
Extreme Case Banking instability Rapid repricing up

Planning for Multi-Generational Asset Preservation

  • Trust structures and estate planning
  • Tax-efficient transfers
  • Education of heirs on risk frameworks

Scenario-Based Wealth Protection and Stress Planning

  • Allocate core holdings to withstand systemic shocks
  • Combine with liquid cash buffers
  • Periodically review allocation against macro trends
This Infographic of Gold Silver Asset Risk 2026: Chart shows Assets Risk of 2026

Does your portfolio survive a 20% 'Japan Unwind' flash-crash? Instantly reveal your liquidity gap and concentration risk score.

Tools, Calculators, Case Studies & Official Sources

How the Gold Silver Asset Risk 2026 Calculator Works

To bridge the gap between macro theory and your actual holdings, our interactive dashboard allows you to simulate how the Gold Silver Asset Risk 2026 scenario impacts your specific net worth. Unlike static spreadsheets, this tool uses real-time volatility multipliers to reveal your ‘Distance to Distress’ during a Yen-driven sell-off. Below, we have configured a ‘Crash-Ready’ Model using professional-tier inputs to demonstrate exactly how a liquidity crunch can compromise an investor who entered the market during the 2024–2025 rallies.

Before diving into the high-risk modeling, it is essential to understand the mechanics behind our Gold Silver Asset Risk 2026 dashboard. The tool isn’t just a spreadsheet; it’s a dynamic stress-test engine that applies real-time 2026 volatility multipliers to your specific entry points.

  • Real-Time Volatility Indexing: The calculator cross-references your Holdings (oz) against the current 2026 price swings (e.g., the recent 9.6% single-day gold drop in late January).
  • The “Underwater” Calculation: By inputting your Avg Buy ($), the dashboard calculates your “Distance to Distress”—showing exactly how much of a market correction your portfolio can absorb before your net worth turns negative.
  • Concentration Scoring: The Port. Alloc % slider is the most critical metric. It weighs your metals exposure against standard 2026 institutional benchmarks (5–15%), flagging any allocation over 20% as a “Liquidity Trap” risk during a Yen-driven sell-off.

Personas, Case Studies, Expert Advice & FAQs

Who Are You in This Market?

The Paper Millionaire This investor has a massive portfolio of real estate and tech stocks. On a dashboard, they look wealthy. However, they lack Capital Efficiency. In a market crash, they are the most vulnerable because their wealth is “locked.” They are often the first ones forced to sell their Gold and Silver at a loss just to keep their other businesses afloat.

The Strategic Hedger This individual understands Real Yield and the “Japan Trigger.” They keep 10-15% of their wealth in physical assets outside the banking system. When the “Paper Millionaires” start panic-selling, the Strategic Hedger is the one buying the dip. They prioritize accessibility over theoretical valuation.


Case Studies

The Liquidity Mirage of 2026
  • The Problem: In early 2026, several high-net-worth business owners found themselves in a paradoxical situation. Despite having a reported net worth in the tens of millions, they faced immediate legal and financing pressures that threatened their entire operations.
  • The Analysis: Their wealth was heavily concentrated in equity stakes, private holdings, and luxury real estate. While these assets were valuable on paper, they could not be liquidated instantly. When an unexpected obligation required $1 million in immediate settlement, their $10 million valuation proved useless. This highlighted a core market truth: a high valuation does not equal resilience; only liquidity does.
  • Implementation & Challenges: To resolve the crisis, these owners were forced to seek emergency bridge loans at predatory interest rates or sell their prime assets at steep “fire-sale” discounts. The primary challenge was the speed of the market shift—by the time they realized they needed cash, the cost of acquiring it had tripled.
  • The Outcome: Those who failed to maintain a “liquid buffer” in physical gold or cash lost up to 30% of their total net worth during the liquidation process. This served as a stark reminder that when the market freezes, the person with the most accessible assets—not the highest paper valuation—wins.

The Institutional Failure (Lehman Brothers Lessons)
  • The Problem: The collapse of Lehman Brothers remains the ultimate warning for the 2026 market. Before its fall, the firm reported over $600 billion in assets. On paper, it was a global titan.
  • The Analysis: The issue wasn’t the total value of what they owned; it was the nature of the assets. When short-term funding markets froze, Lehman’s long-term holdings could not be converted into cash fast enough to meet immediate collateral demands.
  • The Outcome: Within days, the inability to meet short-term obligations triggered a total bankruptcy. This same dynamic is what we see during precious metals sell-offs today. Leveraged holders may own millions in gold futures, but if they lack the immediate liquidity to cover a margin call, they are forced to sell, driving the price down for everyone else.

Expert Advice : Tips for Navigating Liquidity Crises

  • Audit Your “Time-to-Cash” Ratio: Take a look at your total net worth. How much of it can you turn into usable currency within 24 hours without losing more than 5% in fees? If that number is less than 10%, you are at high risk during a forced liquidation event.
  • Ignore the “Paper Price” During Volatility: When you see Gold or Silver drop 5% in an hour, check the physical premiums. Often, the physical price remains stable while the paper price crashes. Don’t let a “digital dip” trick you into selling a physical asset.
  • Watch the Bank of Japan, Not Just the Fed: Modern markets are interconnected. The Blockchain Primitives of the future may be decentralized, but today’s cash flows are still tied to the Japanese Yen. If Japan raises rates, expect a “margin call” on global assets shortly after.
  • Maintain On-Chain Compliance for Quick Moves: If you hold digital versions of real-world assets (RWA Tokenization), ensure your wallets are fully compliant and ready for exit or entry. In a crisis, the person who can move their assets the fastest avoids the heaviest losses.

Frequently Asked Questions (FAQs)

Market Structure & Forced Liquidation Risks

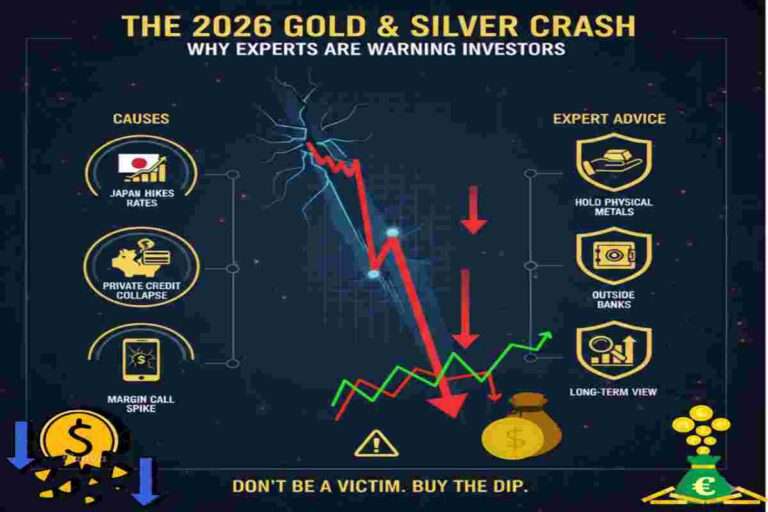
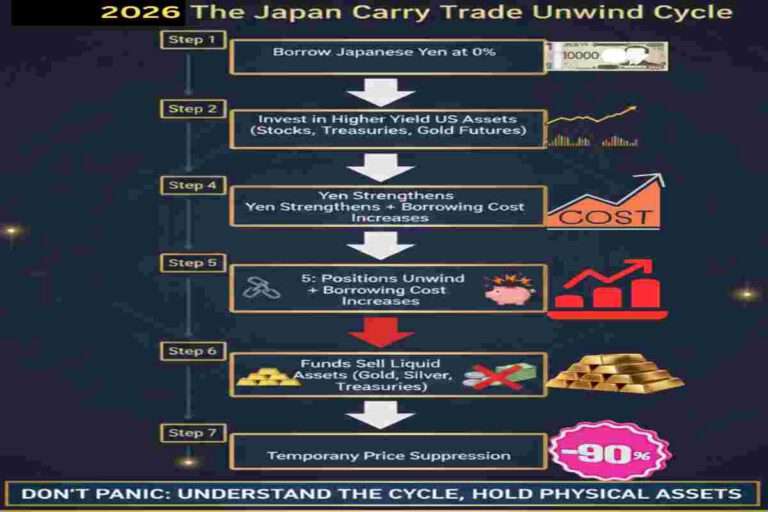
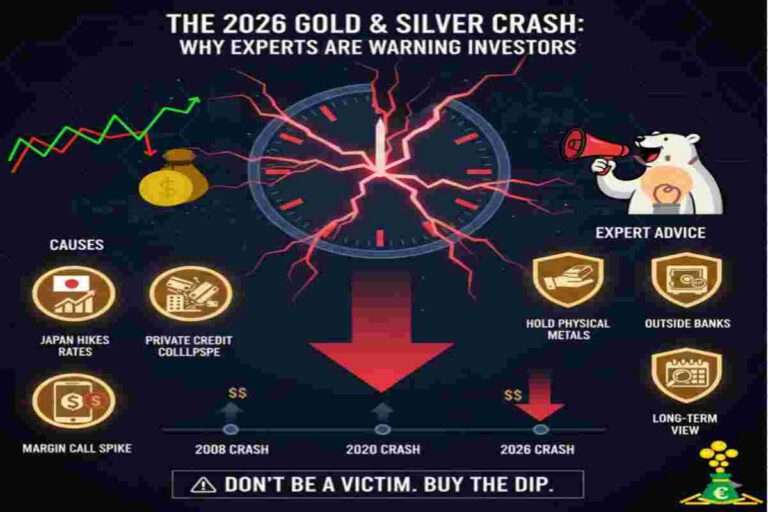
Q: What caused the 2026 gold and silver price decline?
It was driven by margin requirement increases, leveraged positions being unwound, and macro positioning shifts — especially around monetary policy expectations. Large futures margin hikes forced leveraged traders to liquidate positions, putting downward pressure on prices.

Q: Is the 2026 drop in gold and silver prices a crash or a correction?
It is widely viewed as a forced deleveraging event rather than a structural collapse. The repricing reflects liquidity stress and crowded positioning unwinds, not a breakdown in long-term demand.

Q: What is a forced liquidation event in the metals markets?
It occurs when leveraged traders must sell assets to meet margin calls or risk thresholds, often triggering rapid price declines when liquidity thins.

Q: What role did CME margin hikes play in the metals sell-off?
Margin increases required traders to post more collateral. Those without sufficient liquidity were forced to sell, accelerating downward pressure.

Q: What are algorithmic or technical drivers in the metals sell-off?
Automated trading systems, stop-loss cascades, and thin after-hours liquidity can magnify declines when key price levels break.


Paper vs. Physical Market Dynamics

Q: What is the difference between “paper” gold and physical metal?
Paper gold reflects futures contracts and ETFs, which are influenced by leverage and liquidity conditions. Physical metal represents allocated bars or coins and may trade at premiums during stress periods.

Q: Why do physical premiums rise during market stress?
When futures prices fall sharply, demand for physical allocation often rises. Dealers charge premiums due to immediate supply constraints even if paper prices decline.

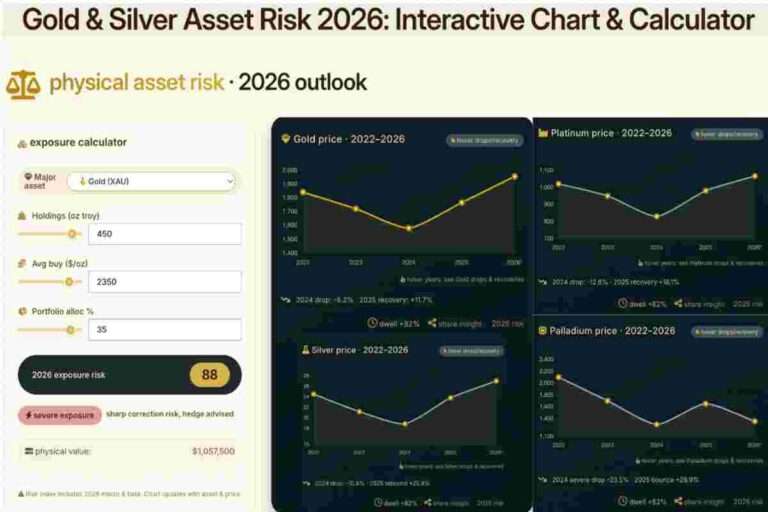
Q: Why did silver fall more sharply than gold?
Silver markets are smaller and more leveraged. When speculative positioning unwinds, percentage volatility is typically higher than gold.

Q: Why are retail investors still buying silver despite price plunges?
Some retail investors view volatility as an accumulation opportunity, particularly in leveraged ETFs or discounted physical supply.

Q: Why do institutions often prefer paper exposure?
Paper instruments offer liquidity, capital efficiency, and ease of trading. However, they also introduce counterparty and rehypothecation risk.


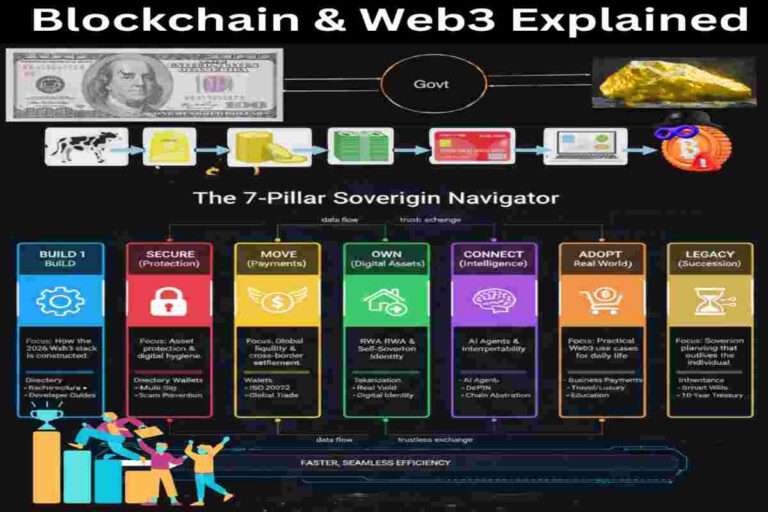
Bitcoin vs. Physical Assets – Market Analysis

Q1: Should I invest only in Bitcoin instead of gold or silver?

A: No. While Bitcoin is a potentially transformative digital store of value, it is still volatile and subject to regulatory risks. Historical precedent shows that physical metals provide stability and legal recognition. A balanced approach — protecting both Bitcoin and metals — is currently more practical for risk management.


Q2: Can governments forcibly take my Bitcoin like they did with gold in the past?

A: No. Bitcoin is decentralized and cannot be seized directly by governments. However, authorities can regulate exchanges, impose taxes, or restrict on-ramps/off-ramps. Full protection requires secure storage strategies, such as cold wallets or hardware wallets.


Q3: If Bitcoin is digital, why should I still consider physical metals?

A: Physical metals remain stable, historically trusted, and less volatile. They act as a safe-haven in times of economic uncertainty or geopolitical crises. Bitcoin and metals serve complementary roles: metals for stability, Bitcoin for growth potential and digital future-readiness.


Q4: Is the shift from physical metals to Bitcoin inevitable?

A: Not necessarily immediate. AI-informed analysis suggests a gradual transition influenced by adoption, regulation, and market confidence. Historical patterns show people shift to new assets when traditional options become less practical or accessible. Bitcoin adoption will likely coexist with metals for years before any potential dominance.


Q5: How much of my portfolio should be in Bitcoin versus metals?

A: Exact allocation depends on your risk tolerance, investment horizon, and financial goals. A common AI-informed strategy is diversification:

  • Physical metals: 40–60% for stability
  • Bitcoin: 20–40% for growth potential
  • The remaining portfolio can include other assets (stocks, bonds, etc.) to manage overall risk.

Macro Drivers: Real Yields, Dollar & Policy

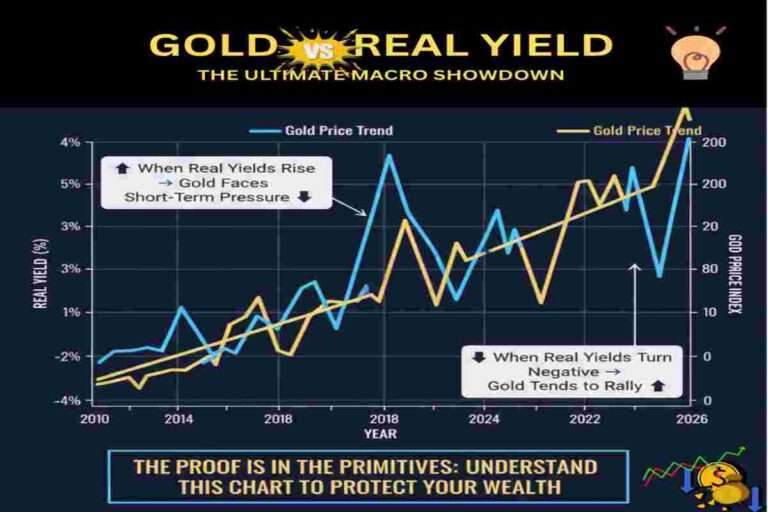
Q: How do real yields affect gold and silver prices?
Real yields — nominal yields minus inflation — are a primary driver. When real yields rise, non-yielding assets like gold become less attractive, pressuring prices.

Q: Does a strong U.S. dollar hurt gold and silver prices?
Yes. Since metals are priced in dollars, a stronger dollar often reduces global demand and creates short-term downside pressure.

Q: How do Federal Reserve policy expectations impact precious metals?
Expectations of tighter policy and higher real yields typically create short-term headwinds, even if long-term inflation or debt dynamics remain supportive.


Long-Term Investment Perspective

Q: Is gold still a safe haven after the 2026 repricing?
Yes. Short-term volatility reflects liquidity conditions, while gold’s long-term role as a hedge against macro uncertainty remains intact.

Q: Should long-term investors be worried about this volatility?
Volatility is common during liquidity stress. Structural demand drivers such as diversification, inflation hedging, and central bank allocation remain supportive.

Q: Can gold and silver recover after a forced sell-off?
Historically, liquidity-driven declines have often been followed by stabilization and recovery once deleveraging concludes.

Q: Are gold and silver still effective diversification tools?
Over long horizons, they have provided portfolio diversification and risk mitigation during macro stress environments.


Market Psychology & Positioning Risk

Q: What is the difference between a correction and a crash in precious metals?
A correction is a natural pullback after gains. A crash implies disorderly selling driven by systemic stress or forced liquidation. The 2026 event reflects rapid liquidity repricing rather than structural demand destruction.

Q: What role does speculative positioning play in metals markets?
When positioning becomes crowded, even minor shifts in policy or liquidity can trigger swift unwinds, amplifying price swings.

Infographic of The 7-Pillar Sovereign Navigator the Web3 Ecosystem Navigating the 2026 Sovereign Ownership Framework

Further Reading & Resources

To help you deepen your understanding of liquidity cycles, real yields, and physical vs. digital asset security, explore our curated guides below. Each resource is designed to complement your 2026 precious metals strategy and provide actionable insights for institutional and high-net-worth investors.

RWA Tokenization 2026: Guide to RWA Portfolios –Tokenized real-world assets are reshaping institutional portfolios. Learn how capital efficiency, compliance frameworks, and tokenized Treasuries interact with liquidity pressures that also affect gold and silver markets. This guide will help you understand where physical and digital allocations converge in 2026.
🔗 Read the full guide

Asset Security 2026: Setting Up Your Digital Fortress – Protecting wealth requires more than just physical custody. Explore institutional-grade frameworks for securing digital and physical assets, including multi-layer custody strategies and risk mitigation during systemic liquidity events. This resource complements our physical metals insights for comprehensive asset protection.
🔗 Read the full guide

Real Yield 2026: Sustainable Income – Rising real yields are a major driver of gold and silver repricing. This guide explains sustainable income strategies, macro yield dynamics, and how institutional allocations respond to changing interest rates and liquidity pressures. Gain context for precious metals positioning in 2026 market cycles.
🔗 Read the full guide

This Infographic of Navigating the Web3 Ecosystem in 2026: The Sovereign Framework

Navigating the Web3 Ecosystem in 2026: The Sovereign Framework

To understand the legal logic and governance standards driving the 2026 decentralized economy, refer to the full Sovereign Framework below:

The Web3 Ecosystem in 2026 is governed not by centralized platforms, but by legal code, protocol rules, and sovereign ownership structures.

At the top of this system sits The Web3 Ecosystem 2026: A Sovereign Ownership Framework. This framework defines the legal logic, governance standards, and system architecture that underpin the decentralized digital economy.

Beneath it operates a foundation layer that explains how Web3 functions in practice—its core architecture, adoption dynamics, and strategic implications.

From this foundation, eight operational pillars translate sovereign ownership into execution. Together, these layers form a unified navigation system for the on-chain economy, outlining how individuals, builders, and institutions secure digital assets, establish ownership, transfer value, tokenize real-world assets, build infrastructure, enable interoperability, and preserve digital continuity over time.

The Web3 Ecosystem 2026 Pillars

Final Perspective: Positioning Before the Liquidity Reset

The 2026 gold and silver repricing cycle reflects a broader transition in global capital markets — from excess liquidity and leveraged expansion to capital discipline and funding constraints. Rising real yields, carry trade unwinds, private credit stress, and tightening margin conditions are not isolated events; they are interconnected signals of a liquidity regime shift.

For investors, the core takeaway is structural: liquidity determines opportunity. During forced liquidation phases, leveraged participants become price takers, while disciplined allocators with strategic cash reserves and secure physical ownership become opportunity buyers. The distinction between paper exposure and allocated metal, between custody risk and direct ownership, and between speculation and insurance becomes critical during systemic repricing.

Market cycles reset leverage. Wealth preservation requires anticipating that reset before it becomes obvious.

In a liquidity-driven environment, the question is not whether volatility will occur — it is whether your allocation framework is built to withstand it.


Official Frameworks & Verified Sources

In light of the 2026 Gold & Silver Crash, ensuring that your Web3 Infrastructure and Sovereign Ownership Framework aligns with recognized global compliance standards is essential. Investors and digital asset holders should rely on official primary regulatory sources rather than secondary interpretations. These frameworks serve as the legal “navigator” for digital property rights, cross-border asset custody, and sovereign wealth protection in 2026.

For official regulatory guidance, refer directly to the primary authorities here: https://www.coingecko.com/en/learn