
Search by title, topic or phrase
Use our Crypto Search Engine 🔍 to find the topics and keywords you're looking for.
Table of Contents
ToggleUse your own holdings, assumed metal price and portfolio allocation to explore position value and simple price-shock scenarios.
The Precious Metals Scenario Analyzer is a transparent calculator for examining exposure to gold, silver, platinum and palladium.
Enter your holdings in ounces and an assumed price per ounce to calculate the position value. You can then enter an assumed portfolio allocation to see the implied portfolio value.
The analyzer also shows simple 5%, 10% and 20% price-decline scenarios and an illustrative chart designed to make the calculations easier to understand.

The calculator uses a small number of user-controlled assumptions. This keeps the calculations visible instead of hiding them behind a proprietary risk score or complex model.
Enter the number of ounces in the position you want to examine.
Use the price per ounce you want to test in the scenario.
Specify what percentage of your portfolio the position represents for the calculation.
The first calculation is straightforward: the number of ounces is multiplied by the assumed price per ounce.
For example, 168 ounces at an assumed price of $1,920 per ounce produces a position value of $322,560.
This is a mathematical scenario value based on the inputs you provide. It does not verify the current market value of a physical holding, brokerage position, futures contract or other financial instrument.
The allocation field is an input you provide. It is not calculated by the analyzer from volatility, historical returns, portfolio correlations or another risk model.
This calculation answers a specific mathematical question: what total portfolio value would be implied if this position represented the percentage you entered? It should not be interpreted as a verified measurement of your actual portfolio.

The analyzer provides three simple downside scenarios. They are sensitivity calculations rather than predictions about what the market will do.
For instance, if a position is valued at $100,000 under your assumed price, a 10% price decline would produce a simple scenario loss of $10,000. The calculation does not estimate the probability of that decline.
The analyzer supports four metals, allowing the same basic exposure and scenario framework to be applied across different precious-metal positions.
Explore an assumed gold position using ounces, price and allocation.
Test silver exposure using the same position-value and scenario calculations.
Model a platinum position with an assumed USD price per ounce.
Examine palladium position value and simple downside scenarios.
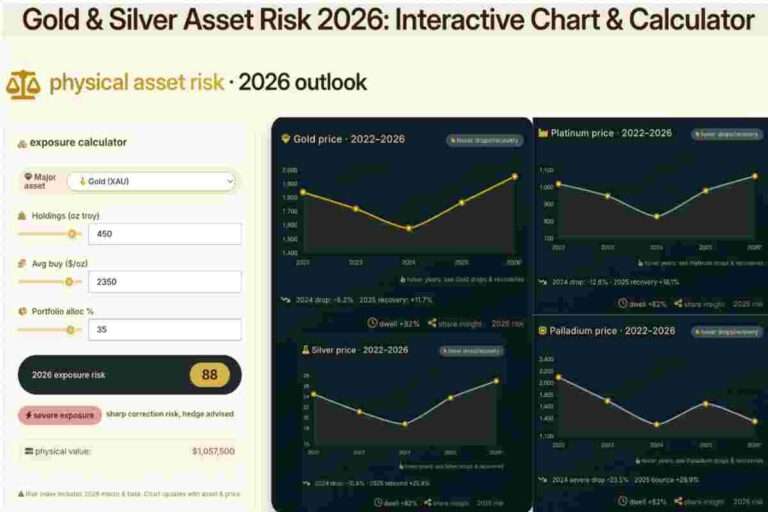
The chart accompanying the calculator is intentionally transparent about its limitations. The 2022–2025 points are illustrative placeholders, not sourced historical prices.
The 2026 point combines a fixed illustrative component with a portion of your assumed price. It is a scenario value generated by the calculator and not a forecast.

This tool is most useful when you want to test a clearly defined assumption rather than obtain a prediction.
No. The calculator uses your assumed price and simple scenario calculations. Its illustrative chart is not a forecast and its displayed historical-looking points are not presented as sourced market data.
No. The concentration figure simply echoes the assumed allocation percentage you enter. It is not produced by a volatility, VaR or portfolio-risk model.
Position value is calculated by multiplying your holdings in ounces by the assumed price per ounce.
It is the portfolio value mathematically implied by the position value and the allocation percentage you entered. It is not a verification of your actual portfolio balance.
No. They are simple mathematical price-shock scenarios showing how the stated position value would change under specified percentage declines.
For deeper research, connect this calculator with your broader precious-metals research library. Use the links below for relevant guides and supporting tools on your site.
Related research: Gold investment guide, Silver investment guide, Platinum investment guide, Palladium investment guide.
Replace these example paths with the exact URLs of your published internal resources before publishing.
The analyzer is a scenario calculator, not a complete investment or portfolio-risk system. It does not calculate volatility, probability of loss, Value at Risk, correlations, liquidity risk or macroeconomic scenarios.
The metal prices entered into the calculator are assumptions supplied by the user. The chart is illustrative and should not be treated as sourced historical performance or a prediction of future prices.
Use the outputs as a way to inspect relationships between holdings, assumed prices, allocation and simple price shocks, and verify important financial information independently before making decisions.
Enter your metal, holdings, assumed price and allocation to see the resulting position value, implied portfolio value and simple price-shock scenarios.
Open the Precious Metals Scenario AnalyzerUse these related resources to move from a quick asset-risk assessment to broader portfolio allocation and digital-asset risk research.
Explore a broader framework for balancing crypto, gold, real estate and other portfolio exposures.
Explore the pillar →Review the wider security framework for protecting digital assets, reducing single points of failure and managing operational risk.
Read the research →Use BIS research as a primary institutional reference for financial stability, markets and macro-financial risk context.
Visit BIS →