
Search by title, topic or phrase
Use our Crypto Search Engine 🔍 to find the topics and keywords you're looking for.
Tokenomics, Liquidity, Governance & Security Framework

Table of Contents
ToggleToken launch risk refers to the possibility that a newly launched cryptocurrency token may experience technical failures, security vulnerabilities, liquidity problems, governance issues, or extreme price volatility during its initial market introduction. These risks are highest in the early stages of a token’s lifecycle when smart contracts, tokenomics, liquidity, and investor behavior are being tested under real market conditions. Evaluating token launch risk helps investors identify potential weaknesses before participating in a token sale or trading a newly listed digital asset.
Every new crypto project goes through a critical early stage after its token launches. This is the period when the project faces the greatest chance of failure. While all cryptocurrencies experience normal market price changes, newly launched tokens also face a set of risks that can prevent the project from growing into a stable and successful ecosystem.
Token launch risk is the chance that a new crypto asset will struggle or fail during its early life. Instead of looking at a single problem, it helps to evaluate several connected factors that influence the project’s long-term success, including:
Rather than viewing these issues separately, token launch risk treats them as parts of one bigger picture. This approach is known as the Pre-Maturity Failure Model because it focuses on the risks that can stop a crypto project from reaching long-term stability before it has a chance to mature.
This combination creates a system where small structural weaknesses can cause outsized failures.
Token launch risk refers to the combined probability of economic collapse, manipulation, or structural failure during and immediately after a token’s introduction to the market.
It is not a single-variable problem. It is a system-level interaction between:
Token Launch Risk
        │
        ├── Economic Design (Tokenomics)
        ├── Market Structure (Liquidity)
        ├── Governance System
        ├── Security Layer (Oracles + Attack Surface)
        └── Human Factors (Insiders + Incentives)
A weakness in any one layer can destabilize the entire launch.
| Risk Layer | What It Means | Impact Level |
|---|---|---|
| Tokenomics | Supply, emissions, inflation design | High |
| Liquidity | Depth of trading pools | Critical |
| Governance | Voting structure and control | High |
| Oracle Systems | Price feed integrity | Critical |
| Insider Allocation | Team/token holder distribution | Critical |
| Vesting | Token unlock schedule | High |
| Market Structure | Exchange + DEX conditions | Medium |
Read More ├── 🧱 Blockchain Foundations
│ ├── Blockchain Primitives
│ └── Web3 Architecture Guide
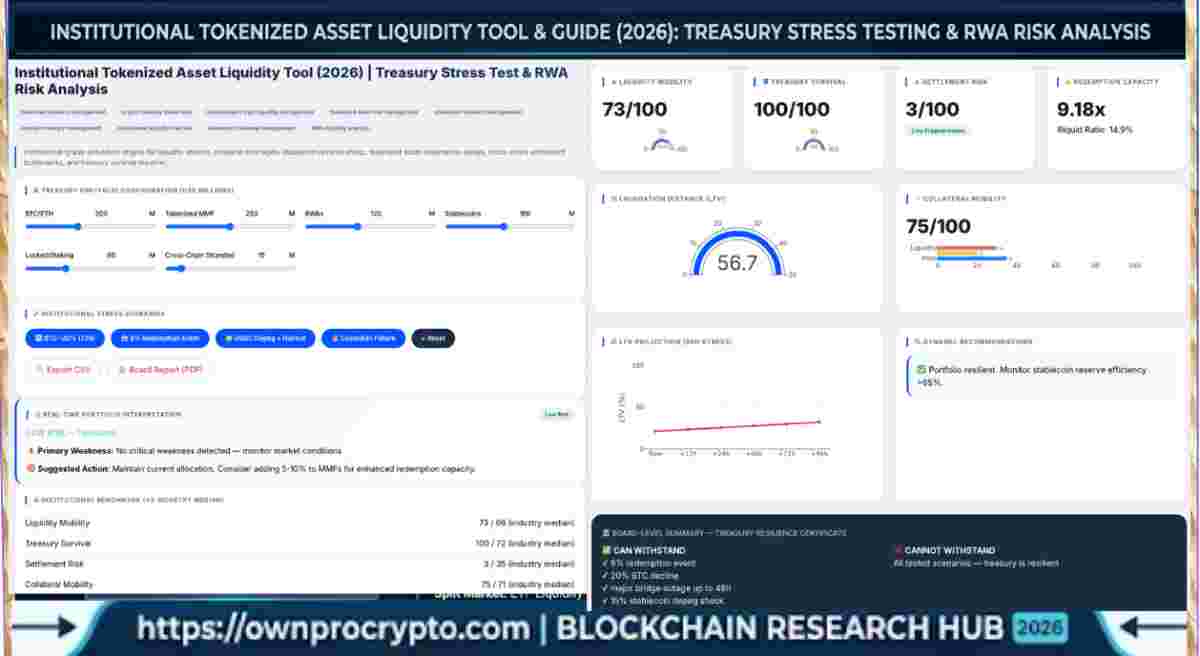
Launch risk measures the probability of economic failure or attack on a new token. It considers liquidity depth, governance structure, tokenomics, and security mechanisms. Lower risk means higher probability of successful launch and sustainable growth.
To evaluate your protocol, the processing engine ingests six fundamental parameters:
Upon ingestion, the simulation matrix models adversarial behaviors across five critical vectors:
Once processing concludes, the system generates an institutional-grade risk diagnostic profile:
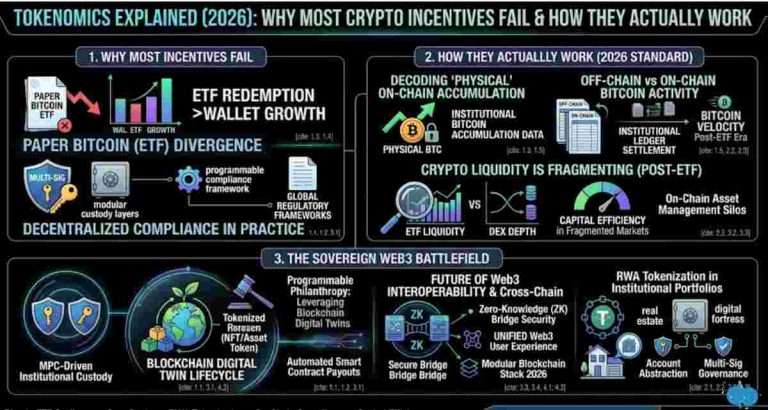
Tokenomics is the foundation of every launch. If tokenomics is flawed, no amount of marketing or liquidity incentives can stabilize the system.
Tokenomics risk comes from:
| Component | Safe Range | Risk Zone |
|---|---|---|
| Team Allocation | <15–20% | >25% |
| Weekly Inflation | <2% | >5% |
| Vesting Period | 24+ months | <12 months |
| Treasury Reserve | 20M+ equivalent | <10M |
| Circulating Supply at Launch | Controlled | Fully unlocked |
Total Supply
│
├── Team (locked / vested)
├── Treasury (ecosystem growth)
├── Liquidity Pool
└── Public Distribution
Healthy launches ensure no single category dominates early circulation.
Tokenomics is not about numbers—it is about behavior control through incentives.
Bad tokenomics creates:
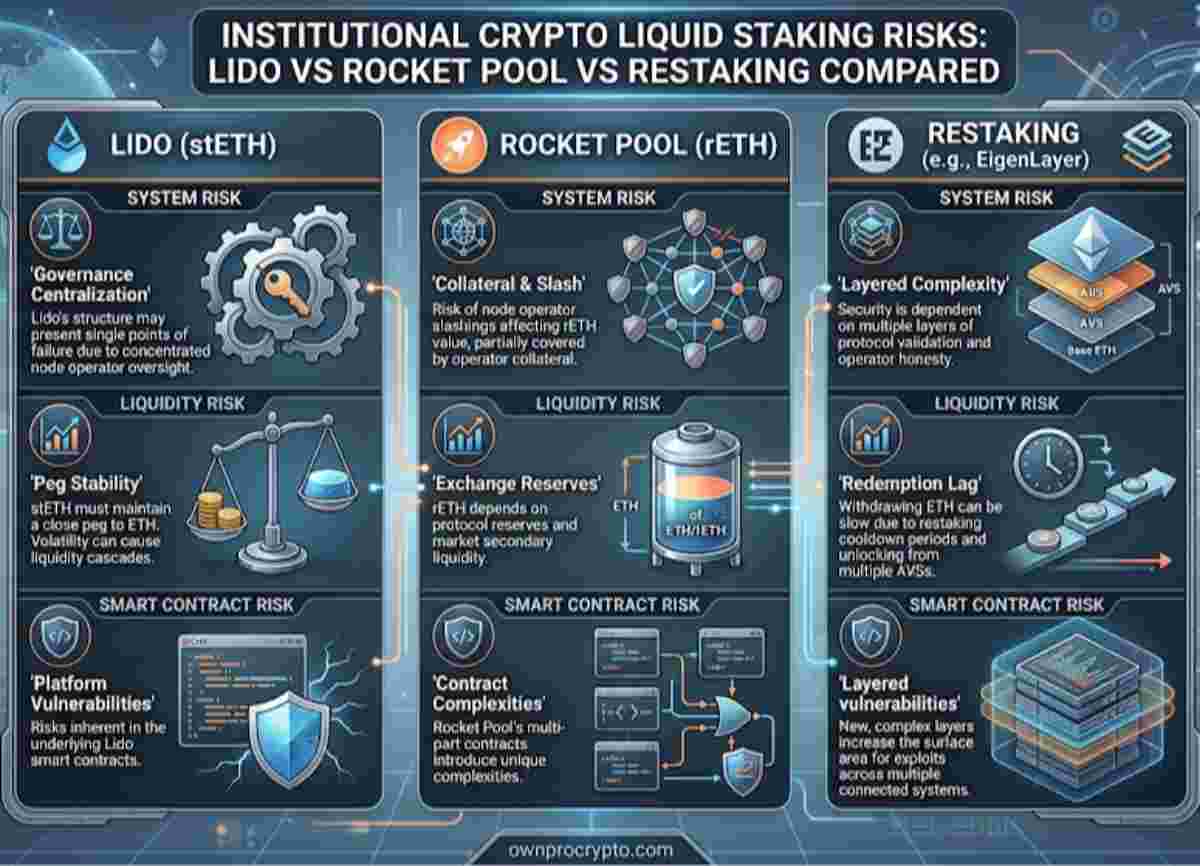
Liquidity is the stability layer of any token.
Without sufficient liquidity, even small trades can cause massive price swings.
| Liquidity Level | Market Behavior | Risk |
|---|---|---|
| <$5M | Extreme volatility | Critical |
| $5M–$15M | High slippage | High |
| $15M–$30M | Stable trading | Moderate |
| $30M+ | Deep market | Low |
Low Liquidity
     ↓
High Slippage
     ↓
Arbitrage Exploits
     ↓
Price Manipulation
     ↓
Market Collapse
Liquidity is not just capital—it is market resistance against manipulation.
Insider allocation is one of the most underestimated drivers of launch failure.
Even if everything else is strong—liquidity, governance, oracles—high insider concentration can destabilize the system.
Insiders control:
This creates asymmetric control over price formation.
| Insider % | Risk Level | Market Behavior |
|---|---|---|
| <10% | Low | Stable distribution |
| 10–20% | Moderate | Controlled influence |
| 20–35% | High | Dump risk present |
| >35% | Critical | Centralized control |
High Allocation
      ↓
Early Unlock Pressure
      ↓
Market Sell-Off
      ↓
Retail Exit Panic
      ↓
Liquidity DrainInsider allocation is not just distribution—it is future sell pressure scheduling.
Vesting controls how tokens enter circulation over time.
Poor vesting creates:
| Vesting Length | Stability Level |
|---|---|
| 0 months | Extremely unstable |
| 6 months | High risk |
| 12 months | Moderate |
| 24 months | Stable |
| 48 months | Highly stable |
Insider risk is heavily dependent on vesting:
| Vesting Period | Risk Multiplier |
|---|---|
| 0 months | x3.0 |
| 6 months | x2.2 |
| 12 months | x1.5 |
| 24+ months | x0.7 |
No Vesting → Sharp Dump Risk
Short Vesting → Volatile Supply Waves
Long Vesting → Smooth Market AbsorptionVesting is not delay—it is supply smoothing architecture.
Inflation defines how fast new tokens enter circulation.
High emissions without matching demand create structural sell pressure.
| Weekly Emission | Risk Level | Outcome |
|---|---|---|
| <1% | Low | Stable supply |
| 1–2% | Moderate | Controlled inflation |
| 2–5% | High | Sell pressure |
| >5% | Critical | Price decay |
High Emissions
      ↓
Increased Circulating Supply
      ↓
Market Sell Pressure
      ↓
Price Devaluation
      ↓
Investor ExitInflation is only safe when paired with real demand generation or token utility expansion.
Treasury acts as the project’s financial backbone.
It stabilizes development, incentives, and liquidity support.
Poor treasury management leads to:
| Treasury Size | Stability |
|---|---|
| <$10M | Weak |
| $10M–$25M | Moderate |
| $25M–$50M | Strong |
| $50M+ | Very strong |
Low Treasury
     ↓
No Market Support
     ↓
Liquidity Withdrawal
     ↓
Price CollapseTreasury is not savings—it is market defense capital.
The most important concept in token launch risk is not individual factors—but interaction effects.
| Layer | Effect |
|---|---|
| Low liquidity + flash loans | Exploit amplification |
| High inflation + weak vesting | Supply shock cycle |
| Insider dominance + weak governance | Centralized control |
| No oracle + low liquidity | Price manipulation |
Weak Tokenomics
     +
Low Liquidity
     +
Weak Governance
     +
Insider Concentration
     ↓
Systemic Market CollapseA token does not fail because of one issue—it fails because multiple small weaknesses align at the same time.
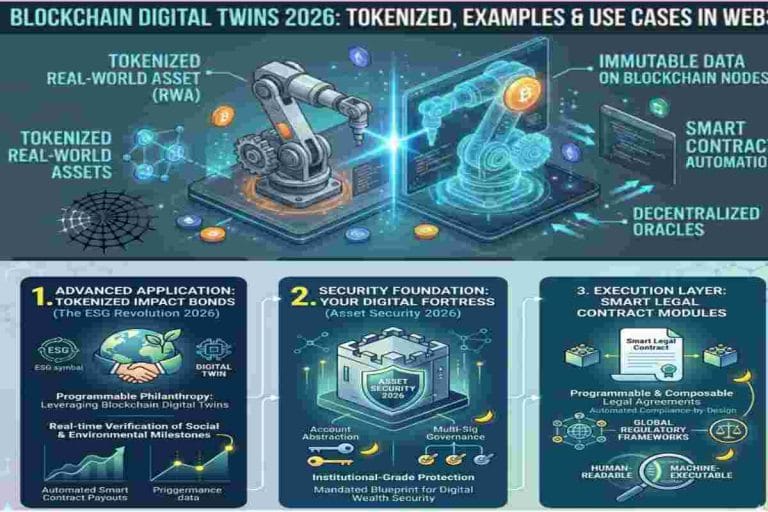
Launching a cryptocurrency token is one of the highest-risk phases in a blockchain project’s lifecycle. Even technically strong projects can lose investor confidence if tokenomics, liquidity management, smart contracts, or launch security are poorly executed. A secure token launch framework combines audited smart contracts, transparent liquidity management, launch platform verification, anti-bot protections, and clearly documented governance procedures. Institutional investors typically evaluate launch security before assessing long-term investment potential because weaknesses introduced during launch often remain permanent.
A comprehensive launch security strategy reduces operational risk, improves market confidence, and demonstrates that the development team has implemented industry best practices before public trading begins.
A token launch security framework is a structured set of controls designed to minimize technical, financial, and governance risks before, during, and after a token generation event (TGE).
A robust framework generally includes:
| Security Component | Purpose |
|---|---|
| Smart Contract Audit | Identifies coding vulnerabilities before deployment |
| Liquidity Lock | Prevents immediate liquidity withdrawal |
| Multi-signature Wallets | Reduces single-point administrative risk |
| Token Vesting | Limits early token dumping by insiders |
| Access Controls | Protects administrative functions |
| Monitoring Tools | Detect suspicious on-chain activity |
| Incident Response Plan | Defines actions during security events |
| Governance Documentation | Improves transparency for investors |
Projects that combine these controls generally present lower launch-related risk than projects relying solely on smart contract audits.
A launch factory is a platform that allows developers to create and deploy tokens using standardized smart contract templates instead of writing contracts entirely from scratch.
Security varies depending on how the launch factory is designed.
| Security Model | Characteristics | Risk Level |
|---|---|---|
| Fully Audited Templates | Standardized audited contracts | Lower |
| Custom Contract Deployment | Developer modifies code | Medium |
| Open Deployment | Minimal verification | Higher |
| Permissioned Launch Platform | Manual review before deployment | Lower |
| Automated Launch Factory | Faster deployment but fewer manual checks | Medium |
Launch factories reduce coding errors but cannot eliminate risks associated with malicious developers, poor tokenomics, or weak governance.
A launch factory liquidity lock is a mechanism that restricts access to liquidity provider (LP) tokens for a predetermined period after a token launch. Instead of allowing developers to immediately withdraw liquidity, LP tokens are placed into a locking smart contract or time-lock service.
This process demonstrates that project founders cannot instantly remove trading liquidity after launch. The lock duration, release conditions, and ownership of locked assets should all be publicly verifiable on-chain.
Liquidity locks are widely used by decentralized exchange (DEX) launches to increase investor confidence during the early stages of trading.
Liquidity is essential for maintaining active trading markets. If developers retain unrestricted control over liquidity, they can remove funds without warning, causing severe price declines and disrupting trading.
Liquidity locks help reduce this risk by:
Although liquidity locks reduce certain risks, they do not guarantee project legitimacy or future success.
The difference between locked and unlocked liquidity significantly affects launch risk.
| Feature | Locked Liquidity | Unlocked Liquidity |
|---|---|---|
| Developer Access | Restricted | Immediate |
| Rug Pull Risk | Lower | Higher |
| Investor Confidence | Higher | Lower |
| Market Stability | Generally stronger | More volatile |
| Transparency | Usually verifiable | Depends on project |
Locked liquidity is generally considered a positive security signal, but investors should still evaluate smart contract quality, governance, and token distribution.
Not every liquidity lock provides the same level of protection. Investors should verify multiple factors before relying on a lock as evidence of project security.
| Factor | Why It Matters |
|---|---|
| Lock Duration | Longer locks generally indicate stronger commitment |
| Lock Percentage | Higher percentages reduce withdrawal risk |
| Lock Provider | Independent providers improve trust |
| On-Chain Verification | Confirms lock status publicly |
| Ownership Structure | Multi-signature ownership reduces centralization |
| Unlock Schedule | Gradual releases reduce market shocks |
A liquidity lock should always be independently verified rather than accepted solely through project marketing materials.
Modern token launches frequently combine multiple protection mechanisms to improve fairness and reduce manipulation.
Common launch protections include:
| Protection Mechanism | Purpose |
|---|---|
| Anti-Bot Protection | Prevents automated purchase manipulation |
| Trading Limits | Restricts excessive early accumulation |
| Whitelisting | Controls initial participant access |
| Vesting Contracts | Limits insider selling pressure |
| Liquidity Lock | Protects trading liquidity |
| Time Locks | Delays administrative actions |
| Multi-signature Wallets | Prevent unilateral fund control |
| Emergency Pause Functions | Allows temporary response to critical vulnerabilities |
Using several complementary mechanisms generally provides stronger launch security than relying on a single control.
Token approval security refers to how users authorize decentralized applications (dApps) to spend tokens on their behalf. Excessive or unlimited token approvals can expose wallet assets if the approved smart contract is later compromised.
Best practices include:
| Security Practice | Benefit |
|---|---|
| Approve Only Required Amounts | Limits potential losses |
| Revoke Unused Approvals | Removes unnecessary permissions |
| Verify Smart Contract Addresses | Reduces phishing risk |
| Use Trusted Wallets | Improves transaction security |
| Review Approval Requests Carefully | Prevents accidental unlimited permissions |
Investors should periodically review existing token approvals, particularly after interacting with new decentralized applications.
Before participating in any token launch, investors should assess the credibility of the launch platform in addition to evaluating the project itself.
| Assessment Area | Questions to Consider |
|---|---|
| Security Audits | Has the platform undergone independent audits? |
| Reputation | Does it have a history of successful launches? |
| Compliance | Are KYC or AML procedures implemented where applicable? |
| Transparency | Are project screening criteria publicly documented? |
| Smart Contract Standards | Are deployment templates audited? |
| Incident History | Has the platform experienced previous exploits? |
| Community Trust | Does it maintain active developer and user support? |
A reputable launch platform cannot eliminate investment risk, but it can reduce operational and technical vulnerabilities.
Many token launches fail because of avoidable planning and security errors rather than technical limitations.
| Mistake | Potential Impact |
|---|---|
| No Smart Contract Audit | Increased exploit risk |
| Unlocked Liquidity | Higher rug pull concerns |
| Poor Tokenomics | Selling pressure and volatility |
| Weak Security Testing | Contract failures after launch |
| Excessive Insider Allocation | Reduced investor confidence |
| Inadequate Documentation | Limited transparency |
| No Vesting Schedule | Early token dumping |
| Poor Communication | Community uncertainty |
Identifying these weaknesses before launch can significantly improve project credibility.
What is a good launch risk score? Below 30 is excellent, 30-50 is moderate, above 70 needs improvement.
How accurate is this tool? Based on real DeFi incidents and economic models. Always combine with professional audit.
Most token launches fail because several moderate risks occur simultaneously rather than a single catastrophic event. A project can often withstand one isolated weakness, but when poor tokenomics, inadequate liquidity, weak security, and governance issues combine, the overall risk increases significantly. For this reason, investors should evaluate the entire launch framework instead of focusing on a single security metric such as a smart contract audit or liquidity lock.
| Failure Type | Root Cause | Typical Outcome |
|---|---|---|
| Liquidity Collapse | Low initial liquidity or inadequate liquidity management | Sharp price decline and reduced market confidence |
| Governance Capture | Concentrated token ownership or whale control | Centralized decision-making and protocol takeover |
| Inflation Shock | Excessive token emissions or poor tokenomics | Sustained selling pressure and price depreciation |
| Oracle Manipulation | Insecure or poorly designed price feeds | Exploitable pricing and financial losses |
| Insider Dumping | No vesting schedule or large insider allocations | Heavy selling immediately after launch |
| Flash Loan Exploit | Weak smart contract design or inadequate security testing | Market manipulation and protocol exploitation |
The highest-risk period for most cryptocurrency projects occurs during the first 7 to 30 days after launch. This phase is commonly referred to as the economic instability window, when market sentiment, liquidity conditions, token distribution, and governance structures are tested under real trading activity. Weaknesses that were not apparent during development often become visible once the token begins trading on public markets.
| Time Period | Typical Market Behavior |
|---|---|
| Day 0–3 | Initial hype, liquidity injection, and high trading volume |
| Day 3–7 | Price discovery as the market establishes a fair valuation |
| Day 7–14 | Insider behavior, profit-taking, and early governance dynamics emerge |
| Day 14–30 | Market either stabilizes through sustained participation or declines due to structural weaknesses |
Beyond the initial launch period, long-term performance depends on multiple interconnected factors. Technical security, economic design, governance, and community adoption all influence whether a project can sustain investor confidence.
| Failure Cause | Description |
|---|---|
| Smart Contract Vulnerabilities | Coding errors, exploits, or unaudited contracts that expose the protocol to attacks |
| Weak Liquidity Management | Insufficient liquidity or poorly managed liquidity pools that increase price volatility |
| Poor Tokenomics | Unsustainable supply schedules, excessive inflation, or weak incentive structures |
| Insider Selling | Large allocations to founders or early investors without appropriate vesting mechanisms |
| Lack of Community Adoption | Low user engagement, limited ecosystem growth, or declining network activity |
| Regulatory Uncertainty | Legal or compliance challenges that affect project operations or exchange listings |
| Security Incidents | Wallet compromises, protocol exploits, or infrastructure breaches that damage trust |
| Unrealistic Roadmaps | Failure to deliver promised milestones, resulting in reduced market confidence |
Successful token launches require more than audited smart contracts or locked liquidity. Long-term resilience depends on a balanced combination of secure code, sustainable tokenomics, transparent governance, adequate liquidity, reliable oracle infrastructure, and realistic execution. Institutional investors typically evaluate these factors together because token launch risk is cumulative—multiple small weaknesses often create greater long-term risk than a single isolated flaw.
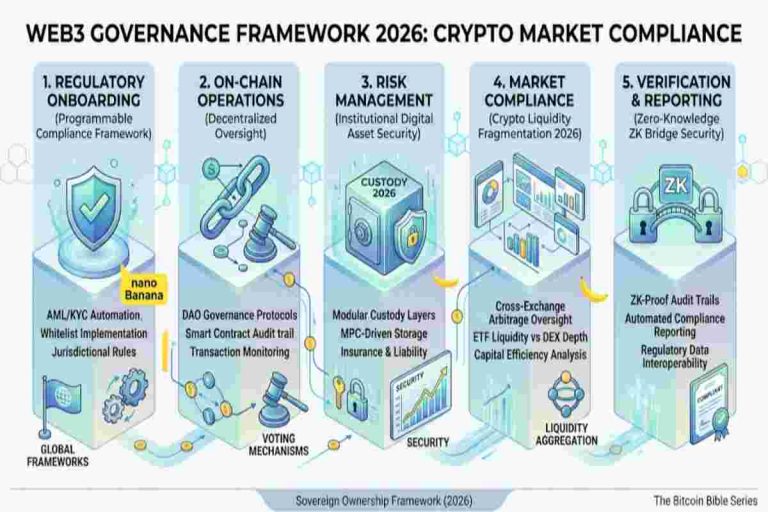
Technical risk assessment is the process of evaluating the security, reliability, and operational resilience of a blockchain protocol before deployment or investment. Unlike market risk, technical risks originate from software vulnerabilities, infrastructure dependencies, protocol design, and smart contract execution. Institutional investors typically assess technical risk alongside tokenomics and governance because technical failures can lead to irreversible financial losses.A comprehensive technical risk assessment examines smart contract security, oracle reliability, attack vectors, upgrade mechanisms, access controls, blockchain infrastructure, and third-party dependencies. Identifying these risks before launch helps reduce exploit exposure and improves long-term protocol stability.
Technical risks refer to vulnerabilities within a blockchain protocol’s software, infrastructure, or architecture that may compromise security, availability, or functionality. Unlike financial risks, technical risks often emerge from coding errors, protocol design flaws, or insufficient testing. Because blockchain transactions are generally irreversible, technical failures can result in permanent loss of funds and reduced market confidence.Modern blockchain projects continuously monitor technical risks through code reviews, penetration testing, formal verification, security audits, and real-time on-chain monitoring.
| Assessment Area | What to Evaluate | Primary Risk |
|---|---|---|
| Smart Contracts | Code quality, testing, audits | Contract exploits |
| Oracle Infrastructure | Price feed security and decentralization | Price manipulation |
| Access Controls | Admin permissions and multisig wallets | Centralization risk |
| Liquidity Security | LP management and lock mechanisms | Liquidity removal |
| Protocol Dependencies | External protocols and integrations | Cascading failures |
| Upgrade Mechanisms | Governance and contract upgrades | Unauthorized changes |
| Network Infrastructure | Validator and blockchain security | Operational disruption |
| Technical Risk | Description | Potential Impact |
|---|---|---|
| Smart Contract Bugs | Programming errors in contract logic | Asset loss or exploits |
| Oracle Failure | Incorrect or manipulated external data | Liquidation and pricing errors |
| Access Control Weakness | Excessive administrative permissions | Unauthorized protocol changes |
| Network Congestion | High transaction demand | Delayed execution and increased costs |
| Bridge Vulnerabilities | Weak cross-chain infrastructure | Cross-chain asset theft |
| Upgrade Errors | Faulty protocol upgrades | Service interruption |
| Dependency Risks | Third-party protocol failures | Cascading ecosystem failures |
Smart contract risk is the possibility that vulnerabilities, coding errors, or flawed business logic within a smart contract may result in financial loss or unintended protocol behavior. Since smart contracts execute automatically without human intervention, even small programming mistakes can become significant security incidents once deployed on a public blockchain.Institutional investors evaluate both the technical quality of the contract and the governance controls surrounding contract upgrades, administrative privileges, and emergency response procedures.
| Risk Factor | Description | Potential Impact |
|---|---|---|
| Coding Errors | Bugs or logic flaws | Contract exploits |
| Reentrancy | Recursive function abuse | Unauthorized fund withdrawals |
| Integer Errors | Overflow or underflow vulnerabilities | Incorrect calculations |
| Permission Misconfiguration | Excessive admin privileges | Centralized control |
| Upgrade Risks | Unsafe contract modifications | Unexpected protocol behavior |
| External Dependencies | Reliance on third-party contracts | System-wide failures |
A smart contract audit is an independent security review that evaluates blockchain code for vulnerabilities, logical errors, and compliance with security best practices before deployment. Although an audit cannot guarantee that a protocol is completely secure, it significantly reduces the likelihood of exploitable vulnerabilities and improves investor confidence.The most effective audits combine automated analysis with manual code review, business logic validation, and penetration testing. Ongoing security assessments are recommended whenever significant contract updates are introduced.
| Audit Component | Purpose |
|---|---|
| Static Code Analysis | Detects common coding vulnerabilities |
| Manual Code Review | Evaluates contract logic and implementation |
| Business Logic Testing | Verifies intended protocol behavior |
| Access Control Review | Assesses administrator permissions |
| Upgrade Mechanism Review | Validates governance and upgrade security |
| Dependency Analysis | Reviews third-party integrations |
| Final Audit Report | Documents findings and remediation status |
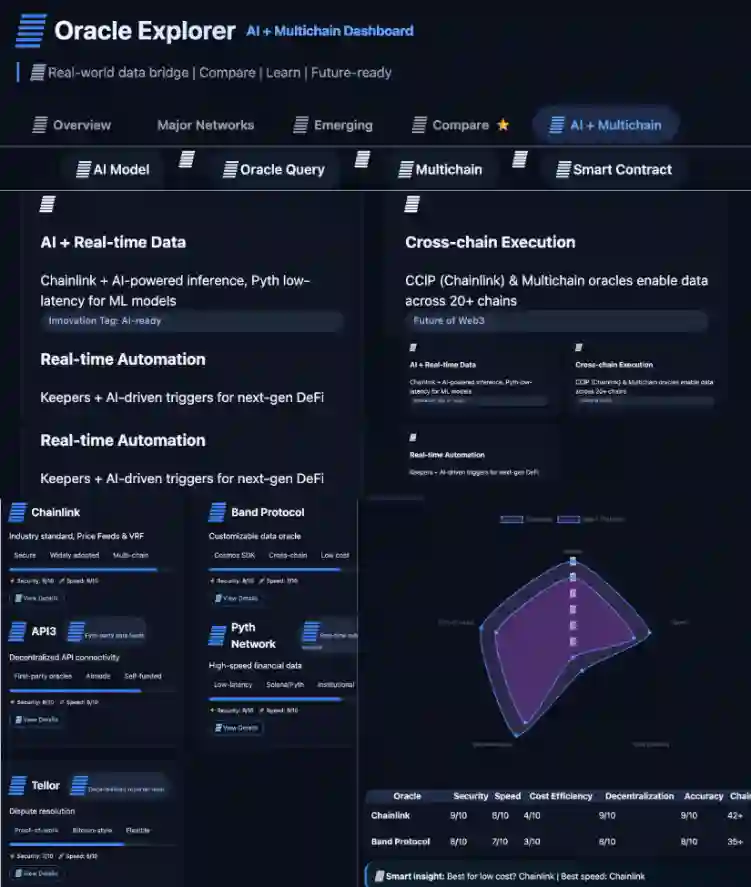
Oracles are the bridge between blockchain systems and real-world data (especially price feeds). If this bridge is weak, everything built on top of it becomes unreliable.
A token can have strong tokenomics and liquidity—but if its oracle is compromised, price manipulation becomes trivial.
| Oracle Type | Reliability | Manipulation Risk | Use Case Safety |
|---|---|---|---|
| No Oracle | None | Extreme | Unsafe |
| Spot Price Feed | Low | High | Basic DEX only |
| TWAP Oracle | Medium | Moderate | Standard DeFi |
| Chainlink | High | Low | Institutional-grade |
| Oracle Type | Security Level | Flash Loan Resistance |
|---|---|---|
| None | Very Low | None |
| Spot Price Feed | Low | Easily manipulated |
| TWAP Oracle | Medium | Moderate resistance |
| Chainlink | High | Strong resistance |
| Dependency | Risk Impact |
|---|---|
| Single oracle source | High systemic risk |
| No fallback oracle | Extreme failure risk |
| Multi-oracle system | Reduced risk |
| Decentralized oracle network | Strong resilience |
| Oracle Type | Security Level | Manipulation Risk | Use Case |
|---|---|---|---|
| Chainlink | High | Low | DeFi pricing |
| TWAP Oracle | Medium | Medium | DEX pricing |
| Custom Oracle | Low | High | Experimental protocols |
| No Oracle | Critical Risk | Very High | Meme / unsafe systems |
Weak Oracle Design
        ↓
Manipulated Price Feed
        ↓
Incorrect Liquidations / Pricing
        ↓
Arbitrage Exploitation
        ↓
Market InstabilityOracle security is not about accuracy alone—it is about resistance to temporary distortion.
Even accurate oracles fail if they can be manipulated for a short window.
Read More : ├── 🔮 Oracle Systems
│ ├── Blockchain Oracles Explained
│ ├── Best Blockchain Oracles
│ └── Blockchain Oracle Dashboard
Flash loans are one of the most disruptive primitives in DeFi. They allow users to borrow massive capital with zero collateral, as long as it is repaid within a single transaction.
This creates a unique condition:
Unlimited temporary capital with atomic execution
If a token launch is poorly designed, flash loans can turn it into a playground for price distortion.
| Factor | Weak Design Signal | Result |
|---|---|---|
| No TWAP oracle | Spot price reliance | Price spoofing |
| Low liquidity | Thin order book | Easy manipulation |
| Poor DEX design | Single pool dependency | Exploitable pricing |
| No circuit breakers | No fail-safe | Rapid collapse |
Flash Loan Borrowing
        ↓
Massive Token Swap Pressure
        ↓
Price Manipulation (Spike or Dump)
        ↓
Oracle Mismatch
        ↓
Liquidations / Arbitrage Exploit
        ↓
Profit Extraction + Market Damage
Flash loan attacks only succeed when liquidity is insufficient.
| Liquidity Level | Attack Difficulty |
|---|---|
| < $5M | Very Easy |
| $5M–$15M | Easy |
| $15M–$30M | Moderate |
| $30M+ | Hard |
Liquidity acts like a shock absorber. Without it, flash loans become a weapon.
Flash loans don’t create new risk—they amplify existing weaknesses instantly.
A strong system ignores them. A weak system collapses under them.
Attack surface refers to the total number of ways a system can be exploited.
In token launches, attack surface expands rapidly due to:
| Component | Risk Type |
|---|---|
| Smart contracts | Code exploits |
| Liquidity pools | Price manipulation |
| Governance system | Voting attacks |
| Token distribution | Insider abuse |
| Oracle feeds | External manipulation |
More Features
      ↓
More Entry Points
      ↓
More Attack Vectors
      ↓
Higher Exploit Probability| System Complexity | Exploit Risk |
|---|---|
| Simple token + LP | Low |
| Multi-chain + governance | Medium |
| Oracle + staking + DAO | High |
| Full DeFi ecosystem | Very High |
Security is not about adding features—it is about controlling interaction complexity.
Governance defines who controls the protocol after launch.
Poor governance design leads to:
| Model | Risk Level | Explanation |
|---|---|---|
| Token Voting | High | Whale dominance |
| Delegated Voting | Medium | Distributed control |
| Council-Based | Low | Central oversight |
| VeToken Model | Low-Medium | Time-weighted control |
Low participation
     ↓
Whale accumulation
     ↓
Proposal influence
     ↓
Protocol captureGovernance is not democracy—it is control distribution design.
Most governance discussions focus on decentralization or voting rights, but real-world attacks target weaknesses in governance mechanics rather than governance itself. Poor parameter design can allow attackers to gain control of treasury funds, pass malicious proposals, manipulate voting outcomes, or seize protocol ownership without exploiting smart contract code.
Governance attack surface analysis evaluates how multiple governance variables interact to determine the likelihood of a successful governance attack. Instead of examining a single metric, the entire governance system is evaluated as a connected security model where voting power, participation rates, proposal requirements, execution delays, and emergency controls all influence protocol resilience.
A governance system may appear decentralized while still being vulnerable if participation remains low or voting power is concentrated among a handful of wallets.
Governance attacks rarely occur because of one weakness. They emerge when several governance parameters combine to reduce the cost of controlling protocol decisions.
Common governance attack vectors include:
Each vector represents a different path an attacker could use to influence protocol decisions.
Instead of waiting until governance proposals are live, governance simulation estimates how protocol parameters affect attack probability before launch.
Simulation models typically evaluate:
These variables combine to estimate governance resilience under different attack scenarios.
Higher participation and longer execution delays generally increase protocol resilience, while concentrated voting power and extremely low quorum requirements reduce attack costs.
Governance security is not binary.
Instead, protocols exist on a spectrum ranging from highly resilient to highly vulnerable.
Typical evaluation factors include:
| Governance Variable | Security Effect |
|---|---|
| Holder concentration | Determines voting control |
| Quorum requirement | Controls proposal difficulty |
| Proposal threshold | Controls proposal creation |
| Timelock duration | Determines response window |
| Participation rate | Measures decentralization quality |
| Emergency controls | Limits catastrophic execution |
Rather than evaluating these independently, governance attack modeling measures how they interact to influence the probability of governance capture.
Attack surface mapping converts governance parameters into measurable risk categories.
Typical governance attack categories include:
This approach allows protocols to identify the weakest governance component before deployment.
Governance simulation tools help protocol teams understand how governance settings affect security before launch.
Rather than relying on assumptions, these tools model multiple governance scenarios to estimate attack likelihood, governance resilience, and takeover timelines under different voting conditions.
Simulation is particularly valuable during protocol design because governance parameters can be adjusted before they become immutable.
Centralization risk measures how much control is concentrated in a small group of actors.
Even decentralized systems often begin with hidden centralization during launch.
| Control Type | Risk Level |
|---|---|
| Fully decentralized | Low |
| DAO + timelock | Moderate |
| Multisig control | High |
| Single admin wallet | Critical |
| Risk Category | Weight | Description | Impact Type |
|---|---|---|---|
| Liquidity Risk | 6% | Depth of trading pools | Economic |
| Flash Loan Risk | 6% | Oracle + exploit exposure | Security |
| Governance Capture | 8% | Voting centralization | Structural |
| Token Inflation | 6% | Emission pressure | Economic |
| Oracle Security | 6% | Data integrity risk | Security |
| Centralization Risk | 5% | Insider control | Governance |
| Vesting Risk | 5% | Token unlock schedule | Economic |
| Attack Surface | 8% | Combined exploit vector | Systemic |
| Score Range | Category | Meaning |
|---|---|---|
| 0–25 | Low Risk | Strong protocol fundamentals |
| 26–45 | Moderate Risk | Stable but improvable |
| 46–70 | High Risk | Structural weaknesses |
| 71–100 | Critical Risk | High probability failure zone |
| Input Factor | Effect |
|---|---|
| Liquidity ↑ | Risk ↓ |
| Inflation ↑ | Risk ↑ |
| Oracle strength ↑ | Risk ↓ |
| Insider allocation ↑ | Risk ↑ |
| Vesting time ↑ | Risk ↓ |
| Governance decentralization ↑ | Risk ↓ |
Centralized Control
        ↓
Decision Bottlenecks
        ↓
Manipulation Risk
        ↓
Community Exit
        ↓
Liquidity DrainCentralization is not always visible in code—it often exists in decision authority structure.
These two concepts are inversely related:
| Metric | Meaning |
|---|---|
| High Attack Surface | High exploitation risk |
| High Long-Term Health | Strong survival probability |
Attack Surface ↑  → Risk ↑
Long-Term Health ↑ → Stability ↑Reducing attack surface automatically improves long-term health—but improving long-term health does not always reduce attack surface unless structural changes are made.
Long-term health evaluates whether a token can survive beyond the launch phase.
It combines multiple dimensions:
| Factor | Weight |
|---|---|
| Treasury stability | High |
| Governance model | High |
| Inflation control | Medium |
| Liquidity depth | Medium |
| Oracle reliability | High |
Short-Term Success
       +
Stable Tokenomics
       +
Strong Governance
       +
Resilient Liquidity
       ↓
Sustainable Protocol GrowthA token can survive launch even with flaws—but it cannot survive compounding weaknesses over time.
Behind all these layers is a weighted system that combines risks into a single launch score.
This is how professional evaluation systems summarize token safety.
| Category | Weight |
|---|---|
| Governance risk | High |
| Oracle security | High |
| Attack surface | High |
| Liquidity risk | Medium |
| Tokenomics risk | Medium |
| Inflation risk | Medium |
Individual Risks
       ↓
Weighted Scoring
       ↓
Normalized Index (0–100)
       ↓
Launch Decision Output| Score | Interpretation |
|---|---|
| 0–25 | Launch Ready |
| 25–45 | Proceed With Caution |
| 45–70 | Needs Improvement |
| 70+ | Not Recommended |
Risk scoring is not prediction—it is structured probability compression.
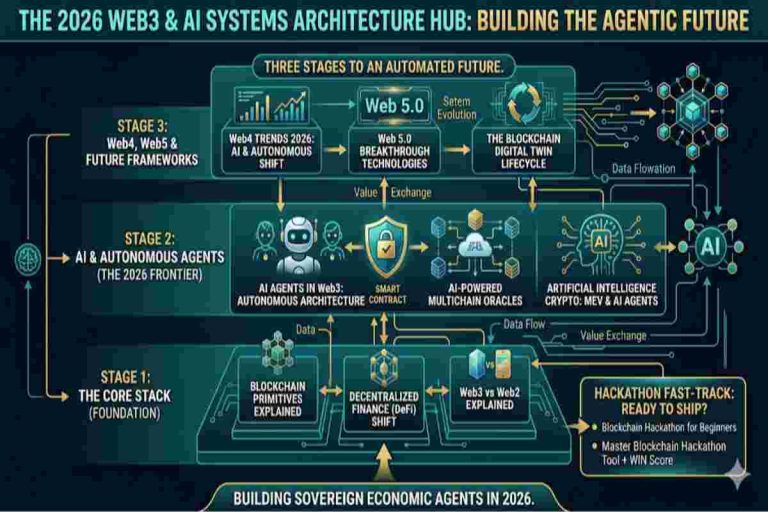
The Web3 Evaluation Stack explains how a blockchain system should be reviewed as a complete, layered structure instead of a single token or project. Each layer plays a different role, and each one adds its own type of risk and value to the system.
┌──────────────────────────────┐
│ Application Layer            │
│ (DeFi, NFTs, RWAs)           │
├──────────────────────────────┤
│ Protocol Layer               │
│ (Chains, Smart Contracts)    │
├──────────────────────────────┤
│ Oracle Layer                 │
│ (Data Feeds, Pricing)        │
├──────────────────────────────┤
│ Interoperability Layer       │
│ (Cross-chain Bridges)        │
├──────────────────────────────┤
│ Infrastructure Layer         │
│ (Nodes, Consensus, L1/L2)    │
└──────────────────────────────┘
Together, these five layers form a complete structure for evaluating any Web3 protocol in a clear and organized way.
| Layer | Risk Type | Example Failure |
|---|---|---|
| Bridge Layer | Asset theft | Bridge hacks |
| Consensus Layer | Chain split | Fork attacks |
| Messaging Layer | Replay attack | Cross-chain duplication |
| Liquidity Layer | Fragmentation | Capital inefficiency |
| Stage | Description |
|---|---|
| Data Ingestion | On-chain metrics |
| Simulation | Risk modeling |
| Stress Testing | Attack simulation |
| Optimization | Parameter tuning |
| Deployment | Real-world adjustment |
A governance digital twin creates a virtual model of protocol governance where different parameter combinations can be tested without risking real treasury assets or token holders.
Instead of changing governance rules on-chain, simulation environments estimate how governance behaves under thousands of potential voting scenarios.
Governance digital twins are increasingly used to evaluate:
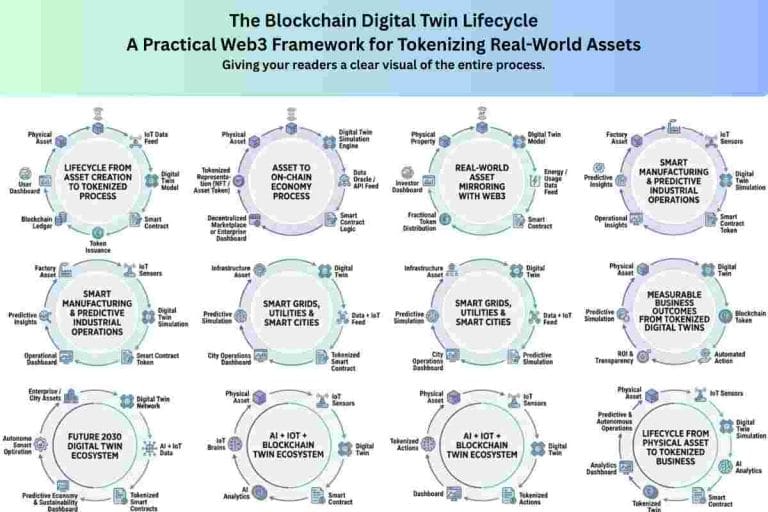
This simulation layer complements tokenomics, treasury, liquidity, and security analysis by modeling governance behavior before deployment. Read More Blockchain Digital Twins
└── The Blockchain Digital Twin Lifecycl
Before launch, governance should be evaluated across multiple security dimensions.
A governance framework should verify:
Weaknesses in any one of these areas can significantly increase governance attack probability.
This framework integrates:
It forms a complete Web3 protocol intelligence stack for evaluation, forecasting, and optimization.
Token launch readiness is not a single metric—it is a composite evaluation system that determines whether a token is safe to launch under real market conditions.
It combines:
| Stage | Score Range | Meaning |
|---|---|---|
| Stage 1 | 0–25 | Fully ready for launch |
| Stage 2 | 25–45 | Launch with caution |
| Stage 3 | 45–70 | Requires improvements |
| Stage 4 | 70–100 | Not ready / high failure risk |
Tokenomics
   + Liquidity
   + Governance
   + Oracle Security
   + Insider Control
   + Attack Surface
        ↓
Launch Readiness Score (0–100)
        ↓
Final Decision OutputLaunch readiness is not about perfection—it is about acceptable risk distribution across all layers.
This checklist is designed as a practical go/no-go filter before launch.
If multiple items fail, launch risk increases exponentially.
| Item | Safe Standard | Status |
|---|---|---|
| Liquidity | $20M+ | ⬜ |
| Inflation | <2% weekly | ⬜ |
| Treasury | $25M+ reserve | ⬜ |
| Team allocation | <20% | ⬜ |
| Vesting period | 24+ months | ⬜ |
| Item | Safe Standard | Status |
|---|---|---|
| Governance model | Delegated or DAO | ⬜ |
| Timelock enabled | Yes | ⬜ |
| Quorum threshold | Balanced | ⬜ |
| Whale resistance | High | ⬜ |
| Item | Safe Standard | Status |
|---|---|---|
| Oracle system | Chainlink / TWAP | ⬜ |
| Flash loan resistance | Strong | ⬜ |
| Contract audit | Completed | ⬜ |
| Attack surface | Minimal | ⬜ |
| Item | Safe Standard | Status |
|---|---|---|
| Liquidity distribution | Multi-pool | ⬜ |
| Market maker support | Active | ⬜ |
| Slippage control | Optimized | ⬜ |
| Price manipulation resistance | High | ⬜ |
A token is not launched safely—it is validated into existence through layered risk elimination.
Token launch risk is not a single problem—it is a multi-layered system of economic, technical, and behavioral risks interacting at the same time.
A successful launch is not defined by hype or initial price movement.
It is defined by:
Token Launch System
     ├── Tokenomics Engine
     ├── Liquidity Layer
     ├── Launch Security & Protection
     ├── Governance Structure
     ├── Oracle Security Layer
     ├── Insider Control System
     ├── Inflation Dynamics
     └── Attack Surface Control
              ↓
Launch Stability OutcomeA token does not fail because it is “bad.”
It fails because its risk layers were not balanced at the same time.
For verified regulatory guidance, check this government/official regulator site:
|
Risk Management System |
Explore cyber risk frameworks and national-level digital security practices 👉https://www.cisa.gov |
|
Security & Custody |
Learn about fraud prevention, custody risks, and digital asset safety 👉 https://www.ftc.gov |
|
Governance & Compliance |
Study global governance frameworks for digital systems 👉 https://www.oecd.org |
│
├── 🧱 Blockchain Foundations
│ ├── Blockchain Primitives
│ └── Web3 Architecture Guide
│
├── 🔮 Oracle Systems
│ ├── Blockchain Oracles Explained
│ ├── Best Blockchain Oracles
│ └── Blockchain Oracle Dashboard
│
└── 🧬 Digital Twin Systems
├── Blockchain Digital Twins
└── The Blockchain Digital Twin Lifecycl
Suggested Read:
CRYPTO SECURITY HUB
├── 1. Learn & Foundations 
│ ├──  Crypto Security Guide
│ ├──  Crypto Security Checklist
│ ├──  Crypto Security Standards
│ ├──  Crypto Security Tools
│ └──  Crypto Threat Intelligence
│
├── 2. Asset Protection
│ ├──  Crypto Self Custody Security Toolkit
│ ├──  Crypto Asset Security 2026
│ └──  Asset Security 2026
│
├── 3. Wallet Security
│ ├──  Wallet Time Machine
│ ├──  Crypto Wallet Approvals
│ └──  Crypto Portfolio Tracker
│
├── 4. Institutional Security
│ ├──  MPC vs Multi Sig Wallets
│ ├──  Institutional Crypto Custody 2026
│ ├──  Why Institutions Are Replacing Multi-Sig with MPC
│ └──  Multi-Cloud MPC Architecture
│
├── 5. Cross-Chain Security
│ ├──  Crypto Bridge Risk Explained
│ ├──  Cross-Chain Blockchain Security
│ └── Zero-Trust Interoperability
│
└── 6. Risk & Scam Intelligence
├──  Crypto Scam Checker
├──  Asset Risk Assessment System
└──  Sovereign Asset Dashboard
OWASP Smart Contract Top 10 (2026 Edition) helps identify critical vulnerabilities in Web3 systems, including logic errors, oracle manipulation, and contract-level exploits.
If you remove all complexity, token launch safety comes down to one principle:
A launch is only as strong as its weakest risk layer.
What is Token Launch Risk?
Token launch risk is the multi-layered vulnerability profile a web3 protocol faces during its deployment lifecycle. It is mapped via the Pre-Maturity Failure Model, which dictates that structural errors in tokenomics, shallow market depth, and improper launch timing can cause a project to fail before its economy ever reaches a state of organic stability.
Why does Token Launch Risk matter to institutional allocators?
Quantifying launch risk is essential because smart contract code execution safety does not guarantee economic sustainability. Understanding the token launch risk lifecycle allows teams to model system-level risk, prevent irreversible capital drain, and build a comprehensive protocol health framework before introducing assets to live market conditions.
What are the primary elements of the Economic Stability Checklist?
The economic stability checklist requires a protocol to run extensive tokenomics risk simulations. Projects must stress-test inflation & emission risk models, evaluate baseline token dilution speed, and establish structured treasury management risk thresholds to ensure the network can withstand volatile secondary market forces.
How do inflation & emission risk parameters trigger launch failures?
When a crypto launch checklist fails to properly throttle the initial token dilution velocity, aggressive emission schedules outpace organic platform demand. This mismatch triggers mercenary yield cycles, where farm-and-dump actors liquidate rewards continuously, pushing the token into an immediate, irreversible price death spiral.
What is the optimal vesting & token unlock strategy to prevent a market collapse?
To survive the first major distribution event, projects must avoid massive, single-day cliff unlocks which historical data shows cause significant spot price corrections. The safest design utilizes daily or monthly linear vesting, ensuring that team allocation risks and early investor claims match or exceed one another to minimize structural supply shocks.
What defines liquidity risk crypto protocols experience at genesis?
Liquidity risk crypto protocols face stems from shallow pool design, where low initial liquidity (in USD millions) creates severe market vulnerability. Without deep baseline capital, the protocol suffers from excessive slippage, allowing predatory arbitrageurs to front-run transactions, sandwich everyday users, and systematically extract value.
How do flash loan attacks exploit structural liquidity gaps?
Flash loan attacks leverage instant, uncollateralized same-block capital to manipulate poorly secured decentralized exchange (DEX) pools. An adversary borrows millions in a single transaction, artificially warps the spot price of an asset within a shallow pool, exploits the resulting oracle discrepancy, and drains the protocol’s primary assets before returning the flash capital.
Why is oracle security tied directly to market manipulation?
Oracles serve as the external data feed for a protocol’s asset valuations. If a project relies on a single DEX pool for price data rather than a decentralized, time-weighted network (like Chainlink), an attacker using flash capital can instantly shift the spot price tick, causing the protocol to miscalculate collateral value and trigger cascading liquidations.
What items must be included in the Market Stability Checklist?
The market stability checklist must mandate a comprehensive attack surface analysis of all liquidity routing paths. It requires teams to evaluate baseline liquidity pool size, establish hard transaction size limits to mitigate flash loans, and contract ethical market-making services to ensure transparent order books and consistent depth.
What is governance risk blockchain networks face post-launch?
Governance risk blockchain systems experience is the threat of architectural or economic manipulation of a protocol’s voting framework. It occurs when a DAO’s structural distribution rules or voting parameters allow malicious actors to coordinate and hijack the consensus mechanism against the community’s intent.
What is the purpose of Governance Attack Surface Mapping?
Governance attack surface mapping is the practice of systematically identifying all systemic entry points and structural vulnerabilities within a DAO’s framework. It traces token concentration boundaries, quorum requirements, and proposal timelines to pinpoint exactly how an adversary could mount a hostile takeover bid.
How does a Governance Digital Twin Simulation protect a protocol?
A governance digital twin simulation is an advanced behavioral modeling environment. It creates a digital replica of the DAO’s voting economy, allowing teams to simulate adversarial actions like vote buying, voter collusion, and sudden whale dominance safely before deploying code to mainnet.
Can whales unilaterally control DAO voting outcomes?
Yes. If insider allocation risks are high or early token distribution is concentrated among few addresses, high-net-worth entities (whales) can bypass community consensus. They can accumulate enough native supply to single-handedly meet quorum thresholds and pass malicious upgrades or treasury drain proposals.
What is the relationship between flash loans and governance exploits?
Flash loans serve as an extreme capital force multiplier in flawed DAO structures. If a protocol allows governance tokens to be borrowed, voted, and returned within the same atomic block transaction, an attacker can borrow a massive volume of capital, push a malicious proposal through to immediate approval, and exit safely without holding any long-term spot exposure.
What components are verified inside the Web3 Evaluation Stack?
The Web3 Evaluation Stack is a core architectural framework that reviews a protocol across three distinct layers: the technical code layer (smart contract vulnerability testing), the economic layer (tokenomics and emissions modeling), and the systemic layer (cross-protocol composability and oracle resilience).
What is the core difference between security and sustainability?
Technical security ensures that smart contracts execute exactly as coded without runtime errors or reentrancy bugs. Economic sustainability measures whether the underlying token incentive models, emission paces, and liquidity depths can support long-term protocol health without suffering system-level collapse or death spirals.
Why are timelocks critical to the Governance Checklist?
Timelocks introduce a mandatory, non-negotiable delay between a vote passing and its technical on-chain execution. This delay acts as a crucial safety valve, giving liquidity providers, users, and core developers a buffer window to evaluate the passed proposal, withdraw capital, or execute emergency defensive maneuvers if an exploit is detected.
How does the system build an overall Risk Score?
The risk engine aggregates inputs across all checklists—including insider concentration, flash capital susceptibility, and liquidity depth—to output a single weighted metric from 0 to 100. This Attack Surface Score is then mapped to a clear threat classification layer (Low, Moderate, High, or Critical) to dictate launch readiness.
What are the primary stages of the Launch Readiness Model?
he launch readiness framework moves through distinct structural phases:
What parameters must be cleared on the Governance Attack Readiness Checklist?
Before launching, the governance checklist requires confirming that:
How does the Final Launch Decision Matrix function?
The final launch decision matrix acts as the ultimate gatekeeper for deployment. It cross-references the protocol’s current Attack Surface Score against real-time market volatility conditions. If any metric falls outside established security baselines, the matrix enforces a hard “No-Go” directive until the vulnerabilities are remediated.
What is the biggest cause of token launch failure?
The most common cause is not a smart contract bug but poor economic design. Unsustainable tokenomics, excessive insider allocations, weak liquidity, aggressive emissions, low governance participation, and inadequate treasury controls often combine to create systemic instability during the first months after launch.
How can a DAO prevent governance attacks?
DAO governance becomes more resilient by distributing voting power across a wider holder base, maintaining healthy participation rates, enforcing appropriate quorum requirements, introducing execution timelocks, requiring meaningful proposal thresholds, and protecting treasury operations with emergency governance controls where appropriate.
What is a governance attack vector?
A governance attack vector is any weakness that allows an attacker to influence protocol decisions for personal benefit. Examples include vote buying, whale accumulation, flash loan voting, proposal manipulation, quorum exploitation, and treasury governance attacks.
What is governance capture?
Governance capture occurs when one individual, organization, or coordinated group gains enough voting influence to control protocol decisions, treasury allocations, parameter changes, or software upgrades without meaningful community oversight.
What is governance attack simulation?
Governance attack simulation models how attackers could exploit governance parameters before a protocol launches. By testing different combinations of voting concentration, quorum levels, proposal thresholds, participation rates, and timelocks, teams can identify weaknesses before they become exploitable on-chain.
What is an Attack Surface Score?
An Attack Surface Score is a weighted measurement that estimates the overall likelihood of successful protocol exploitation by combining governance, tokenomics, liquidity, treasury, oracle, and technical security risks into a single evaluation metric.
Why is voter participation important for DAO security?
High voter participation makes governance manipulation more expensive because attackers must control a much larger percentage of actively voting tokens. Low participation reduces the cost of influencing proposals and increases governance capture risk.
How often should token launch risk be reassessed?
Token launch risk should be evaluated before deployment, after governance parameter updates, during major token unlock events, following treasury changes, after protocol upgrades, and whenever market conditions significantly affect liquidity or token distribution.
Can a secure smart contract still have high launch risk?
A: Yes. A protocol may have audited smart contracts while still facing significant launch risk due to weak tokenomics, concentrated ownership, poor governance design, shallow liquidity, or unsustainable incentive structures. Technical security and economic security evaluate different aspects of protocol health.
What is the difference between launch risk and protocol risk?
Launch risk focuses on vulnerabilities during the early stages of deployment when token distribution, liquidity formation, governance participation, and market adoption are still developing. Protocol risk evaluates the long-term operational health of the network after launch.
How is Governance Risk Score calculated?
A Governance Risk Score is calculated by evaluating multiple governance parameters together rather than relying on a single metric. Common inputs include voting power concentration, quorum requirements, proposal thresholds, voter participation, execution timelocks, and emergency governance controls. These factors are weighted to estimate the likelihood of governance capture, malicious proposal execution, treasury attacks, and other governance exploits.
| Allocation | Percentage | Lock Period | Vesting | Notes |
|---|---|---|---|---|
| Community Rewards | 35% | None | Linear 36 months | Incentive programs |
| Team | 18% | 12 months | 36 months | Founder allocation |
| Investors | 15% | 6 months | 24 months | Seed funding |
| Treasury | 22% | None | DAO controlled | Ecosystem growth |
| Advisors | 10% | 12 months | 18 months | Strategic partners |
| Holder | Initial Unlock | Cliff | Vesting Duration | Risk Level |
|---|---|---|---|---|
| Founders | 0% | 12 Months | 36 Months | Low |
| Seed Investors | 5% | 6 Months | 24 Months | Medium |
| Advisors | 0% | 12 Months | 18 Months | Low |
| Treasury | 10% | None | DAO Voting | Low |
| Community | 15% | None | Continuous | Low |
| DEX/CEX | Liquidity (USD) | Lock Duration | LP Burned | Status |
|---|---|---|---|---|
| Exchange Alpha | $2.5M | 12 Months | Yes | Secure |
| Exchange Beta | $850K | 6 Months | No | Monitor |
| Exchange Gamma | $5.2M | Permanent | Yes | Strong |
| Exchange Delta | $1.1M | 24 Months | Yes | Healthy |
| Exchange Epsilon | $420K | 3 Months | No | Risk |
| Proposal Type | Voting Power | Approval % | Timelock | Executor |
|---|---|---|---|---|
| Treasury Spend | Token Vote | 60% | 48 Hours | DAO |
| Parameter Change | Token Vote | 51% | 24 Hours | Multisig |
| Upgrade | DAO | 67% | 72 Hours | Governance |
| Emergency Pause | Multisig | N/A | Immediate | Security Council |
| Grants | Community | 55% | 48 Hours | Treasury |
| Auditor | Audit Date | Severity Found | Fixed | Status |
|---|---|---|---|---|
| Audit Firm A | Jan 2026 | 2 Medium | Yes | Passed |
| Audit Firm B | Feb 2026 | 1 High | Yes | Passed |
| Audit Firm C | Mar 2026 | None | N/A | Clean |
| Audit Firm D | Apr 2026 | 3 Low | Yes | Passed |
| Audit Firm E | May 2026 | 1 Medium | Yes | Passed |
| Risk | Likelihood | Impact | Mitigation | Status |
|---|---|---|---|---|
| Rug Pull | Low | High | Locked liquidity | Protected |
| Flash Loan | Medium | High | Oracle checks | Mitigated |
| Governance Attack | Medium | High | Timelock | Active |
| Oracle Failure | Low | Medium | Multiple feeds | Stable |
| Key Compromise | Low | Critical | Multisig | Protected |
| Category | Budget | Percentage | Controller | Frequency |
|---|---|---|---|---|
| Development | $12M | 35% | DAO | Quarterly |
| Marketing | $8M | 24% | Foundation | Monthly |
| Grants | $5M | 15% | Community | Ongoing |
| Operations | $6M | 18% | Treasury | Monthly |
| Reserve | $3M | 8% | DAO | Emergency |
| Proposal | Votes For | Votes Against | Participation | Result |
|---|---|---|---|---|
| Treasury Expansion | 81% | 19% | 42% | Passed |
| Burn Mechanism | 73% | 27% | 38% | Passed |
| New Validator | 69% | 31% | 45% | Passed |
| Fee Reduction | 49% | 51% | 36% | Rejected |
| Ecosystem Fund | 88% | 12% | 47% | Passed |
| Utility | Required Tokens | User Benefit | Frequency | Priority |
|---|---|---|---|---|
| Governance | 1,000 | Voting | Monthly | High |
| Staking | 500 | Rewards | Daily | High |
| Fee Discount | 250 | Lower Fees | Continuous | Medium |
| NFT Access | 100 | Premium Content | Weekly | Medium |
| Validator | 50,000 | Network Rewards | Continuous | High |
| Year | Circulating Supply | Inflation | Burn Rate | Max Supply |
|---|---|---|---|---|
| 2026 | 120M | 8% | 2% | 1B |
| 2027 | 150M | 7% | 3% | 1B |
| 2028 | 180M | 5% | 4% | 1B |
| 2029 | 205M | 3% | 5% | 1B |
| 2030 | 225M | 2% | 5% | 1B |
| Validator | Uptime | Stake | Commission | Status |
|---|---|---|---|---|
| Node Alpha | 99.9% | 8M | 5% | Active |
| Node Beta | 99.5% | 5M | 7% | Active |
| Node Gamma | 98.8% | 3M | 6% | Active |
| Node Delta | 99.7% | 10M | 4% | Active |
| Node Epsilon | 97.9% | 2M | 8% | Active |
| Requirement | Status | Evidence | Reviewer | Last Updated |
|---|---|---|---|---|
| KYC Process | Complete | Verified | Legal Team | Jan 2026 |
| AML Policy | Complete | Approved | Compliance | Feb 2026 |
| Audit Report | Complete | Published | Security | Mar 2026 |
| Treasury Disclosure | Complete | Dashboard | Finance | Apr 2026 |
| Risk Policy | Complete | Governance Docs | DAO | May 2026 |
| Item | Status | Owner | Due Date | Notes |
|---|---|---|---|---|
| Smart Contract | Complete | Dev Team | Jan 10 | Audited |
| Liquidity | Complete | Treasury | Jan 12 | Locked |
| Website | Complete | Marketing | Jan 13 | Live |
| Whitepaper | Complete | Research | Jan 08 | Published |
| Governance | Complete | DAO | Jan 15 | Ready |
| Indicator | Current Value | Threshold | Signal | Action |
|---|---|---|---|---|
| Liquidity Ratio | 2.8 | >2.0 | Healthy | Maintain |
| Whale Holdings | 21% | <30% | Safe | Monitor |
| Daily Volume | $5.5M | >$1M | Strong | Continue |
| Volatility | 18% | <25% | Moderate | Observe |
| TVL | $42M | >$20M | Healthy | Expand |
| Category | Weight | Score | Risk Rating | Recommendation |
|---|---|---|---|---|
| Tokenomics | 25% | 90 | Low | Maintain vesting |
| Liquidity | 20% | 84 | Low | Increase LP depth |
| Governance | 20% | 82 | Low | Improve participation |
| Security | 25% | 95 | Very Low | Continue audits |
| Compliance | 10% | 88 | Low | Periodic review |